Grundy County, Illinois
| Grundy County, Illinois | |
|---|---|
.jpg) Grundy County Courthouse | |
 Location in the U.S. state of Illinois | |
 Illinois's location in the U.S. | |
| Founded | February 17, 1841 |
| Named for | Felix Grundy |
| Seat | Morris |
| Largest city | Morris |
| Area | |
| • Total | 430 sq mi (1,114 km2) |
| • Land | 418 sq mi (1,083 km2) |
| • Water | 12 sq mi (31 km2), 2.9% |
| Population | |
| • (2010) | 50,063 |
| • Density | 120/sq mi (50/km2) |
| Congressional district | 16th |
| Time zone | Central: UTC−6/−5 |
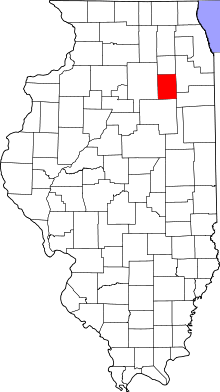
Grundy County is a county in the U.S. state of Illinois. According to the 2010 census, it has a population of 50,063.[1] Its county seat is Morris.[2]
Grundy County is part of the Chicago-Naperville-Elgin, IL-IN-WI Metropolitan Statistical Area.
In 2010, the center of population of Illinois was in Grundy County, just northeast of the village of Mazon.[3]
Illinois's state fossil, the unique and bizarre Tully Monster, was first found in Mazon Creek. Grundy County Speedway is located in Morris. Grundy County is also home to Dresden Generating Station—the first privately financed nuclear power plant built in the United States—and the Morris Operation—the only de facto high-level radioactive waste storage site in the United States.
History
Grundy County was established on February 17, 1841. It was formed out of LaSalle County and named after U.S. Attorney General Felix Grundy (1777-1840).[4] The county was well known for its coal mines[5] and attracted miners from Pennsylvania and other regions to work its deposits. The Diamond Mine Disaster occurred in Grundy County. The disaster took the lives of 68 men and boys who were trapped underground when water broke through into the mine after days of heavy rain and the pumps could not keep up with the rising water. 22 bodies were eventually recovered, the remaining 44 were left in the mine and the mine was sealed. Today a marker stands where they felt the majority of the bodies probably ended up.(https://grundy.illinoisgenweb.org/history/coalmin/minevict.php)
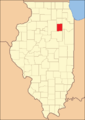 Grundy County at the time of its creation in 1841
Geography
According to the U.S. Census Bureau, the county has a total area of 430 square miles (1,100 km2), of which 418 square miles (1,080 km2) is land and 12 square miles (31 km2) (2.9%) is water.[6]
Climate and weather
| Morris, Illinois | ||||||||||||||||||||||||||||||||||||||||||||||||||||||||||||
|---|---|---|---|---|---|---|---|---|---|---|---|---|---|---|---|---|---|---|---|---|---|---|---|---|---|---|---|---|---|---|---|---|---|---|---|---|---|---|---|---|---|---|---|---|---|---|---|---|---|---|---|---|---|---|---|---|---|---|---|---|
| Climate chart (explanation) | ||||||||||||||||||||||||||||||||||||||||||||||||||||||||||||
| ||||||||||||||||||||||||||||||||||||||||||||||||||||||||||||
| ||||||||||||||||||||||||||||||||||||||||||||||||||||||||||||
In recent years, average temperatures in the county seat of Morris have ranged from a low of 13 °F (−11 °C) in January to a high of 85 °F (29 °C) in July, although a record low of −24 °F (−31 °C) was recorded in January 1985 and a record high of 103 °F (39 °C) was recorded in June 1988. Average monthly precipitation ranged from 1.59 inches (40 mm) in February to 4.16 inches (106 mm) in June.[7]
Major highways
Adjacent counties
- Kendall (north)
- Will (east)
- Kankakee (southeast)
- Livingston (south)
- LaSalle (west)
Demographics
| Historical population | |||
|---|---|---|---|
| Census | Pop. | %± | |
| 1850 | 3,023 | — | |
| 1860 | 10,379 | 243.3% | |
| 1870 | 14,938 | 43.9% | |
| 1880 | 16,732 | 12.0% | |
| 1890 | 21,024 | 25.7% | |
| 1900 | 24,136 | 14.8% | |
| 1910 | 24,162 | 0.1% | |
| 1920 | 18,580 | −23.1% | |
| 1930 | 18,678 | 0.5% | |
| 1940 | 18,398 | −1.5% | |
| 1950 | 19,217 | 4.5% | |
| 1960 | 22,350 | 16.3% | |
| 1970 | 26,535 | 18.7% | |
| 1980 | 30,582 | 15.3% | |
| 1990 | 32,337 | 5.7% | |
| 2000 | 37,535 | 16.1% | |
| 2010 | 50,063 | 33.4% | |
| Est. 2017 | 50,586 | [8] | 1.0% |
| U.S. Decennial Census[9] 1790-1960[10] 1900-1990[11] 1990-2000[12] 2010-2013[1] | |||
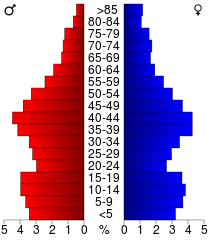
As of the 2010 United States Census, there were 50,063 people, 18,546 households, and 13,431 families residing in the county.[13] The population density was 119.8 inhabitants per square mile (46.3/km2). There were 19,996 housing units at an average density of 47.8 per square mile (18.5/km2).[6] The racial makeup of the county was 93.7% white, 1.2% black or African American, 0.7% Asian, 0.2% American Indian, 2.7% from other races, and 1.5% from two or more races. Those of Hispanic or Latino origin made up 8.2% of the population.[13] In terms of ancestry, 28.3% were German, 23.0% were Irish, 12.7% were Italian, 9.4% were Polish, 8.6% were English, 7.1% were Norwegian, and 3.0% were American.[14]
Of the 18,546 households, 38.6% had children under the age of 18 living with them, 57.8% were married couples living together, 9.7% had a female householder with no husband present, 27.6% were non-families, and 22.5% of all households were made up of individuals. The average household size was 2.69 and the average family size was 3.16. The median age was 36.1 years.[13]
The median income for a household in the county was $64,297 and the median income for a family was $75,000. Males had a median income of $58,491 versus $36,592 for females. The per capita income for the county was $27,895. About 5.2% of families and 6.9% of the population were below the poverty line, including 8.0% of those under age 18 and 6.5% of those age 65 or over.[15]
Communities
City
Villages
- Braceville
- Carbon Hill
- Channahon (part)
- Coal City (part)
- Diamond (part)
- Dwight (part)
- East Brooklyn
- Gardner
- Godley
- Kinsman
- Mazon
- Minooka (mostly)
- Nettle Creek
- South Wilmington
- Verona
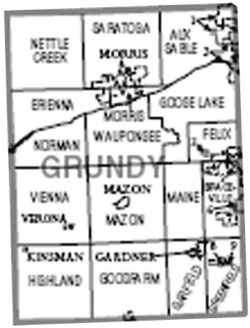
Townships
Grundy County is divided into seventeen townships:
Unincorporated communities
Politics
| Year | Republican | Democratic | Third Parties |
|---|---|---|---|
| 2016 | 57.9% 13,454 | 34.7% 8,065 | 7.4% 1,718 |
| 2012 | 53.2% 11,343 | 44.3% 9,451 | 2.4% 519 |
| 2008 | 48.1% 10,687 | 49.8% 11,063 | 2.2% 482 |
| 2004 | 56.5% 11,198 | 42.7% 8,463 | 0.9% 170 |
| 2000 | 52.5% 8,709 | 45.3% 7,516 | 2.2% 359 |
| 1996 | 41.5% 6,177 | 45.4% 6,759 | 13.2% 1,966 |
| 1992 | 39.0% 6,346 | 37.6% 6,122 | 23.4% 3,797 |
| 1988 | 60.9% 8,743 | 38.5% 5,525 | 0.7% 93 |
| 1984 | 67.0% 9,595 | 32.6% 4,671 | 0.4% 59 |
| 1980 | 63.6% 8,397 | 30.1% 3,970 | 6.3% 837 |
| 1976 | 57.4% 7,581 | 41.9% 5,534 | 0.7% 86 |
| 1972 | 70.7% 8,725 | 29.0% 3,584 | 0.3% 32 |
| 1968 | 59.5% 6,607 | 30.7% 3,407 | 9.8% 1,091 |
| 1964 | 51.3% 5,522 | 48.7% 5,246 | |
| 1960 | 61.9% 6,948 | 38.1% 4,276 | 0.0% 4 |
| 1956 | 74.5% 7,640 | 25.5% 2,618 | 0.0% 3 |
| 1952 | 70.1% 7,347 | 29.8% 3,118 | 0.1% 13 |
| 1948 | 64.4% 5,954 | 35.2% 3,255 | 0.3% 31 |
| 1944 | 63.9% 6,310 | 35.9% 3,544 | 0.2% 22 |
| 1940 | 61.4% 6,593 | 38.2% 4,105 | 0.4% 43 |
| 1936 | 52.6% 5,360 | 44.0% 4,481 | 3.4% 344 |
| 1932 | 48.2% 4,491 | 51.1% 4,755 | 0.7% 69 |
| 1928 | 61.5% 5,126 | 38.1% 3,174 | 0.4% 29 |
| 1924 | 64.0% 4,337 | 10.9% 742 | 25.1% 1,701 |
| 1920 | 80.1% 4,647 | 13.8% 803 | 6.1% 355 |
| 1916 | 66.4% 4,811 | 30.9% 2,241 | 2.7% 197 |
| 1912 | 29.2% 1,919 | 24.8% 1,172 | 46.1% 2,179 |
| 1908 | 63.1% 3,127 | 27.4% 1,359 | 9.5% 471 |
| 1904 | 69.7% 3,448 | 17.0% 841 | 13.3% 656 |
| 1900 | 65.5% 3,735 | 29.6% 1,687 | 4.9% 280 |
| 1896 | 59.7% 3,246 | 38.1% 2,074 | 2.2% 119 |
| 1892 | 50.3% 2,159 | 44.0% 1,892 | 5.7% 245 |
As part of Yankee rural Northern Illinois, Grundy County has generally been powerfully Republican, although it did support Progressive Theodore Roosevelt in 1912 when the Republican Party was mortally divided. Only one Democratic presidential candidate has ever won an absolute majority of Grundy County’s vote – Franklin D. Roosevelt in 1932 – although in recent times the county has trended a little more Democratic and both Bill Clinton in 1996 and Barack Obama in 2008 won pluralities. However, in 2016 with economic concerns in the “Rust Belt”, Donald Trump did better than any Republican in this traditional GOP county since 1984 when Ronald Reagan came within 3,819 votes of clean-sweeping all fifty states.
In September 2017, Governor Bruce Rauner said he would sign a controversial abortion funding expansion measure, House Bill 40, into law. Critics said that the law will increase the number of abortions from the reported 64 in Grundy County in 2015. Illinois Right to Life estimated that the new law will lead to 12,000 additional abortions each year in Illinois at a cost of more than $21 million. The estimate was based on Medicaid figures from the late 1970s, which was the last time Illinois had unrestricted Medicaid funded abortions.[17]
See also
References
- 1 2 "State & County QuickFacts". United States Census Bureau. Archived from the original on July 11, 2011. Retrieved July 5, 2014.
- ↑ "Find a County". National Association of Counties. Archived from the original on 2011-05-31. Retrieved 2011-06-07.
- ↑ "Centers of Population by State: 2010". United States Census Bureau. Archived from the original on January 3, 2014. Retrieved July 5, 2014.
- ↑ Adams, James N. (compiler) (1989), Keller, William E., ed., Illinois Place Names, Springfield: Illinois State Historical Society, p. 581, ISBN 0-912226-24-2
- ↑ https://books.google.com/books?id=K3UUAAAAYAAJ&pg=PR5-IA3&lpg=PR5-IA3&dq=township+formation+grundy+co+il&source=bl&ots=4TvueknW_E&sig=DhwT0AhJOPH4gJlTYZMfc4agTyw&hl=en&sa=X&ei=WW79VIecB9HkgwS60YPIDA&ved=0CEEQ6AEwBQ#v=onepage&q=township%20formation%20grundy%20co%20il&f=false History of Grundy County, Illinois: Containing a History from the Earliest Settlement to the Present Time ..., Biographical Sketches, Portraits of Some of the Early Settlers, Prominent Men, Etc, Volumes 1-2 (Google eBook) O.L. Basken & Company, Historical Publishers, 1882 - Grundy County (Ill.) - 518 pages
- 1 2 "Population, Housing Units, Area, and Density: 2010 - County". United States Census Bureau. Retrieved 2015-07-11.
- 1 2 "Monthly Averages for Morris, Illinois". The Weather Channel. Retrieved 2011-01-27.
- ↑ "Population and Housing Unit Estimates". Retrieved May 3, 2018.
- ↑ "U.S. Decennial Census". United States Census Bureau. Archived from the original on May 12, 2015. Retrieved July 5, 2014.
- ↑ "Historical Census Browser". University of Virginia Library. Retrieved July 5, 2014.
- ↑ "Population of Counties by Decennial Census: 1900 to 1990". United States Census Bureau. Retrieved July 5, 2014.
- ↑ "Census 2000 PHC-T-4. Ranking Tables for Counties: 1990 and 2000" (PDF). United States Census Bureau. Retrieved July 5, 2014.
- 1 2 3 "DP-1 Profile of General Population and Housing Characteristics: 2010 Demographic Profile Data". United States Census Bureau. Retrieved 2015-07-11.
- ↑ "DP02 SELECTED SOCIAL CHARACTERISTICS IN THE UNITED STATES – 2006-2010 American Community Survey 5-Year Estimates". United States Census Bureau. Retrieved 2015-07-11.
- ↑ "DP03 SELECTED ECONOMIC CHARACTERISTICS – 2006-2010 American Community Survey 5-Year Estimates". United States Census Bureau. Retrieved 2015-07-11.
- ↑ Leip, David. "Dave Leip's Atlas of U.S. Presidential Elections". uselectionatlas.org.
- ↑ "Critics say HB 40 likely to increase number of abortions over 64 on record for Grundy County in 2015". Grundy Reporter. 2017-09-28. Retrieved 2018-04-09.
External links
Places adjacent to Grundy County, Illinois | ||||||||||
|---|---|---|---|---|---|---|---|---|---|---|
| ||||||||||
Municipalities and communities of Grundy County, Illinois, United States | ||
|---|---|---|
| Cities | ||
| Villages | ||
| Townships | ||
| Unincorporated communities | ||
| Footnotes | ‡This populated place also has portions in an adjacent county or counties | |
| Major city |  | |
|---|---|---|
| Cities (over 30,000 in 2010) | ||
| Towns and villages (over 30,000 in 2010) |
| |
| Counties | ||
| Regions | ||
| Sub-regions | ||
