Clinton County, Illinois
| Clinton County, Illinois | |
|---|---|
 | |
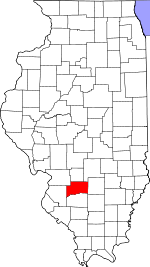 Location in the U.S. state of Illinois | |
 Illinois's location in the U.S. | |
| Founded | 1824 |
| Named for | DeWitt Clinton |
| Seat | Carlyle |
| Largest city | Breese |
| Area | |
| • Total | 503 sq mi (1,303 km2) |
| • Land | 474 sq mi (1,228 km2) |
| • Water | 29 sq mi (75 km2), 5.8% |
| Population | |
| • (2010) | 37,762 |
| • Density | 80/sq mi (30/km2) |
| Congressional district | 15th |
| Time zone | Central: UTC−6/−5 |
| Website |
www |
Clinton County is a county located in the U.S. state of Illinois. As of the 2010 census, the population was 37,762.[1] Its county seat is Carlyle.[2]
In 1960, the U.S. Census Bureau placed the mean center of U.S. population in Clinton County.[3]
Clinton County is part of the St. Louis, MO-IL Metropolitan Statistical Area.
History
In 1805, prior to the establishment of the county, the territorial government established a post road from its capital (Vincennes, Indiana) to St. Louis, Missouri, passing through the county.[4] In 1808 a wagon road was laid out through what is now Clinton County. The road extended from the Goshen Settlement to the Ohio salt works and crossed the Kaskaskia River at Carlyle.[5]
Clinton County was created on December 27, 1824 out of Washington, Fayette, and Bond Counties. It was named in honor of the seventh Governor of New York, DeWitt Clinton, who helped build the Erie Canal.[6]
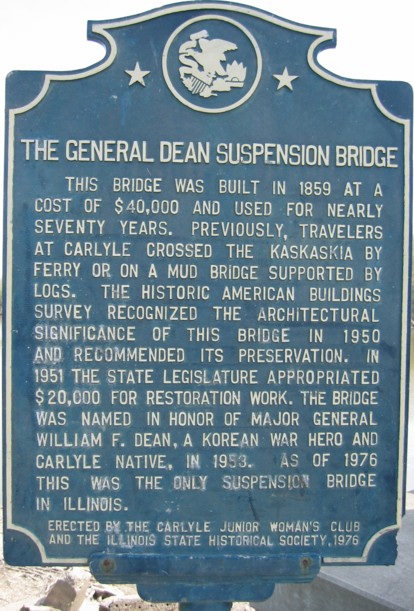
Crossing the Kaskaskia became much easier when the bridge now known as the General Dean Suspension Bridge was built in 1859, at a cost of $40,000.[7] Before the bridge was constructed travelers had been forced to cross by ferry or over a mud bridge.[8][9] The Illinois General Assembly set aside $20,000 for bridge restoration in 1951 and in 1953 the bridge was named after William F. Dean.[7]
Geography
According to the U.S. Census Bureau, the county has a total area of 503 square miles (1,300 km2), of which 474 square miles (1,230 km2) is land and 29 square miles (75 km2) (5.8%) is water.[10] Eldon Hazlet State Recreation Area and South Shore State Park are in Clinton County. Its southern border is the Kaskaskia River.
Climate and weather
| Carlyle, Illinois | ||||||||||||||||||||||||||||||||||||||||||||||||||||||||||||
|---|---|---|---|---|---|---|---|---|---|---|---|---|---|---|---|---|---|---|---|---|---|---|---|---|---|---|---|---|---|---|---|---|---|---|---|---|---|---|---|---|---|---|---|---|---|---|---|---|---|---|---|---|---|---|---|---|---|---|---|---|
| Climate chart (explanation) | ||||||||||||||||||||||||||||||||||||||||||||||||||||||||||||
| ||||||||||||||||||||||||||||||||||||||||||||||||||||||||||||
| ||||||||||||||||||||||||||||||||||||||||||||||||||||||||||||
In recent years, average temperatures in the county seat of Carlyle have ranged from a low of 19 °F (−7 °C) in January to a high of 88 °F (31 °C) in July, although a record low of −22 °F (−30 °C) was recorded in January 1994 and a record high of 104 °F (40 °C) was recorded in July 1980. Average monthly precipitation ranged from 2.17 inches (55 mm) in January to 4.44 inches (113 mm) in June.[11]
Major highways
Adjacent counties
- Bond County - north
- Fayette County - northeast
- Madison County - northwest
- Marion County - east
- St. Clair County - west
- Washington County - south
Demographics
| Historical population | |||
|---|---|---|---|
| Census | Pop. | %± | |
| 1830 | 2,330 | — | |
| 1840 | 3,718 | 59.6% | |
| 1850 | 5,139 | 38.2% | |
| 1860 | 10,941 | 112.9% | |
| 1870 | 16,285 | 48.8% | |
| 1880 | 18,714 | 14.9% | |
| 1890 | 17,411 | −7.0% | |
| 1900 | 19,824 | 13.9% | |
| 1910 | 22,832 | 15.2% | |
| 1920 | 22,947 | 0.5% | |
| 1930 | 21,369 | −6.9% | |
| 1940 | 22,912 | 7.2% | |
| 1950 | 22,594 | −1.4% | |
| 1960 | 24,029 | 6.4% | |
| 1970 | 28,315 | 17.8% | |
| 1980 | 32,617 | 15.2% | |
| 1990 | 33,944 | 4.1% | |
| 2000 | 35,535 | 4.7% | |
| 2010 | 37,762 | 6.3% | |
| Est. 2016 | 37,729 | [12] | −0.1% |
| U.S. Decennial Census[13] 1790-1960[14] 1900-1990[15] 1990-2000[16] 2010-2013[1] | |||

As of the 2010 United States Census, there were 37,762 people, 14,005 households, and 9,760 families residing in the county.[17] The population density was 79.7 inhabitants per square mile (30.8/km2). There were 15,311 housing units at an average density of 32.3 per square mile (12.5/km2).[10] The racial makeup of the county was 93.4% white, 3.5% black or African American, 0.4% Asian, 0.2% American Indian, 1.2% from other races, and 1.1% from two or more races. Those of Hispanic or Latino origin made up 2.8% of the population.[17] In terms of ancestry, 54.8% were German, 9.8% were Irish, 5.8% were English, and 5.6% were American.[18]
Of the 14,005 households, 32.7% had children under the age of 18 living with them, 56.5% were married couples living together, 8.7% had a female householder with no husband present, 30.3% were non-families, and 25.1% of all households were made up of individuals. The average household size was 2.55 and the average family size was 3.02. The median age was 39.3 years.[17]
The median income for a household in the county was $55,278 and the median income for a family was $66,682. Males had a median income of $45,119 versus $34,051 for females. The per capita income for the county was $25,392. About 5.2% of families and 7.8% of the population were below the poverty line, including 9.2% of those under age 18 and 5.7% of those age 65 or over.[19]
Education
- Carlyle Community Unit School District 1
- Patoka Community Unit School District 100
- Sandoval Community Unit School District 501
- Wesclin Community Unit School District 3
- Central Community High School, Breese
- Mater Dei Catholic High School, Breese
Communities
Cities
Villages
Townships
Clinton County is divided into fifteen townships:
Politics
| Year | Republican | Democratic | Third Parties |
|---|---|---|---|
| 2016 | 71.3% 12,412 | 22.7% 3,945 | 6.1% 1,062 |
| 2012 | 63.9% 10,524 | 34.0% 5,596 | 2.2% 361 |
| 2008 | 54.0% 9,357 | 44.2% 7,657 | 1.7% 300 |
| 2004 | 59.7% 10,219 | 39.7% 6,797 | 0.7% 115 |
| 2000 | 55.7% 8,588 | 41.7% 6,436 | 2.6% 403 |
| 1996 | 43.8% 6,065 | 44.1% 6,104 | 12.1% 1,675 |
| 1992 | 36.5% 5,771 | 42.3% 6,686 | 21.3% 3,365 |
| 1988 | 56.2% 7,681 | 43.4% 5,935 | 0.5% 64 |
| 1984 | 66.4% 9,233 | 33.3% 4,628 | 0.3% 38 |
| 1980 | 62.5% 8,500 | 32.9% 4,470 | 4.6% 623 |
| 1976 | 53.0% 7,245 | 45.9% 6,275 | 1.1% 151 |
| 1972 | 62.4% 7,931 | 37.4% 4,756 | 0.2% 25 |
| 1968 | 53.8% 6,561 | 36.5% 4,453 | 9.7% 1,185 |
| 1964 | 39.0% 4,692 | 61.0% 7,339 | |
| 1960 | 48.0% 5,709 | 52.0% 6,188 | 0.1% 6 |
| 1956 | 63.5% 7,378 | 36.5% 4,242 | 0.1% 7 |
| 1952 | 58.2% 6,760 | 41.8% 4,853 | 0.1% 7 |
| 1948 | 51.5% 5,128 | 47.9% 4,773 | 0.6% 62 |
| 1944 | 62.8% 6,753 | 36.7% 3,944 | 0.5% 53 |
| 1940 | 62.0% 7,582 | 37.3% 4,558 | 0.7% 90 |
| 1936 | 32.8% 3,653 | 48.1% 5,355 | 19.2% 2,137 |
| 1932 | 24.4% 2,548 | 73.9% 7,736 | 1.7% 182 |
| 1928 | 30.8% 3,031 | 68.8% 6,774 | 0.5% 47 |
| 1924 | 29.7% 2,358 | 21.3% 1,693 | 49.0% 3,891 |
| 1920 | 63.7% 4,564 | 23.2% 1,661 | 13.1% 939 |
| 1916 | 42.6% 3,423 | 52.3% 4,201 | 5.1% 413 |
| 1912 | 20.5% 973 | 56.3% 2,674 | 23.2% 1,103 |
| 1908 | 39.1% 2,104 | 56.1% 3,016 | 4.8% 260 |
| 1904 | 43.0% 1,848 | 50.1% 2,153 | 6.9% 295 |
| 1900 | 41.6% 1,964 | 55.9% 2,637 | 2.5% 120 |
| 1896 | 41.8% 1,863 | 57.6% 2,572 | 0.6% 27 |
| 1892 | 34.7% 1,361 | 61.0% 2,393 | 4.4% 171 |
As part of German Catholic Central Illinois, nineteenth-century Clinton County was opposed to the “Yankee” Civil War and the Northern Illinois residents who supported it and the Republican Party. Consequently, the county was solidly Democratic for the six decades after the Civil War, turning Republican only due to opposition to Woodrow Wilson’s post-World War I policies towards Germany. Its first flirt with Republicanism was short-lived: in 1924 Clinton was the nation’s southeasternmost county – and the solitary one in Illinois – to give a plurality to Robert M. La Follette Sr., and in 1928 its residents voted powerfully for coreligionist Al Smith despite a landslide loss nationally.
1936, despite a landslide win for Franklin D. Roosevelt, saw Clinton County, like many other German Catholic counties in the Midwest, show a more permanent trend away from the Democratic Party: owing to a strong vote for Union Party candidate William Lemke, Roosevelt only won a plurality, and with powerful local opposition to World War II Wendell Willkie and Thomas E. Dewey won over 62 percent of the county’s vote in the two elections held whilst World War II was in progress. Since then only Catholic John F. Kennedy and Lyndon B. Johnson during his 1964 landslide have obtained a majority in the county for the Democratic Party, although county namesake Bill Clinton did win pluralities in both 1992 and 1996. Since 2000, opposition to the Democratic Party’s liberal views on social issues has caused a powerful swing towards the Republican Party: Donald Trump won the county against namesake Hillary Clinton by 48.6 percent in 2016 – the worst performance ever by a Democrat.
See also
References
- Specific
- 1 2 "State & County QuickFacts". United States Census Bureau. Archived from the original on July 8, 2011. Retrieved July 4, 2014.
- ↑ "Find a County". National Association of Counties. Archived from the original on 2011-05-31. Retrieved 2011-06-07.
- ↑ "Mean Center of Population for the United States: 1790 to 2000" (PDF). United States Census Bureau. Archived from the original (PDF) on 2001-11-03. Retrieved 2011-09-17.
- ↑ Douglas K. Meyer (2000). Making the Heartland Quilt. SIU Press. p. 58. ISBN 0-8093-2289-7. Retrieved 2011-09-11.
- ↑ "" 1913 Commercial History of Clinton County, Illinois Archived 2011-07-23 at the Wayback Machine. from clinton.ilgenweb.net. Retrieved 10 NOV 2010
- ↑ Allan H. Keith, Historical Stories: About Greenville and Bond County, IL. Retrieved August 15, 2007.
- 1 2 Attractions & Outdoor Recreation Archived 2007-02-07 at the Wayback Machine., City of Carlyle, Official site
- ↑ "Suspension Bridge, Spanning Kaskaskia River, Carlyle, Clinton, IL". Historic American Buildings Survey. Library of Congress. Archived from the original on 2012-10-02. Retrieved 2011-09-11.
- ↑ Plaque on site, Photograph of plaque at Bridgemeister Archived 2007-09-27 at the Wayback Machine..
- 1 2 "Population, Housing Units, Area, and Density: 2010 - County". United States Census Bureau. Retrieved 2015-07-11.
- 1 2 "Monthly Averages for Carlyle, Illinois". The Weather Channel. Archived from the original on 2012-10-23. Retrieved 2011-01-27.
- ↑ "Population and Housing Unit Estimates". Archived from the original on May 29, 2017. Retrieved June 9, 2017.
- ↑ "U.S. Decennial Census". United States Census Bureau. Archived from the original on May 12, 2015. Retrieved July 4, 2014.
- ↑ "Historical Census Browser". University of Virginia Library. Archived from the original on August 16, 2012. Retrieved July 4, 2014.
- ↑ "Population of Counties by Decennial Census: 1900 to 1990". United States Census Bureau. Archived from the original on April 24, 2014. Retrieved July 4, 2014.
- ↑ "Census 2000 PHC-T-4. Ranking Tables for Counties: 1990 and 2000" (PDF). United States Census Bureau. Archived (PDF) from the original on December 18, 2014. Retrieved July 4, 2014.
- 1 2 3 "DP-1 Profile of General Population and Housing Characteristics: 2010 Demographic Profile Data". United States Census Bureau. Retrieved 2015-07-11.
- ↑ "DP02 SELECTED SOCIAL CHARACTERISTICS IN THE UNITED STATES – 2006-2010 American Community Survey 5-Year Estimates". United States Census Bureau. Retrieved 2015-07-11.
- ↑ "DP03 SELECTED ECONOMIC CHARACTERISTICS – 2006-2010 American Community Survey 5-Year Estimates". United States Census Bureau. Retrieved 2015-07-11.
- ↑ Leip, David. "Dave Leip's Atlas of U.S. Presidential Elections". uselectionatlas.org. Archived from the original on 23 March 2018. Retrieved 1 May 2018.
- General
External links
Places adjacent to Clinton County, Illinois | ||||||||||
|---|---|---|---|---|---|---|---|---|---|---|
| ||||||||||
Municipalities and communities of Clinton County, Illinois, United States | ||
|---|---|---|
| Cities | ||
| Villages | ||
| Townships | ||
| Unincorporated communities | ||
| Ghost town | ||
| Footnotes | ‡This populated place also has portions in an adjacent county or counties | |
| Counties | 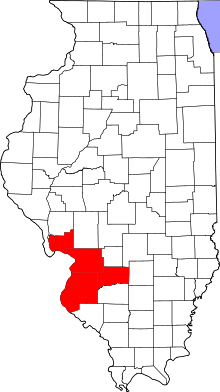 | |
|---|---|---|
| Major Cities (25,000+) | ||
| Cities (5,000-25,000) | ||
| Communities (1,000-5,000) |
| |
| Interstates | ||
| Airports | ||
| Colleges | ||
| Sports teams |
| |
| Topics | 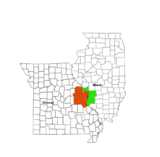 | |
|---|---|---|
| Central city | ||
| Largest cities (over 50,000 in 2010) | ||
| Medium-sized cities (over 20,000 in 2010) | ||
| Largest towns and villages (over 10,000 in 2010) |
| |
| Missouri Counties | ||
| Illinois Counties | ||
| Subregions | ||

| Counties |  | |
|---|---|---|
| Mid-sized cities (25,000+) | ||
| Small Cities (10,000-25,000) | ||
| Small Cities (5,000-10,000) | ||
| Interstates | ||
| Airports/Military bases |
| |
| Universities | ||
| Colleges | ||
| Sports teams based in the Southern Illinois | ||