United States presidential election in Kansas, 2016
|
|
|
| Turnout |
67.40%  |
|---|
|
|
 County Results
|
Trump
40-50%
50-60%
60-70%
70-80%
80-90%
>90%
|
Clinton
60–70%
|
|
|
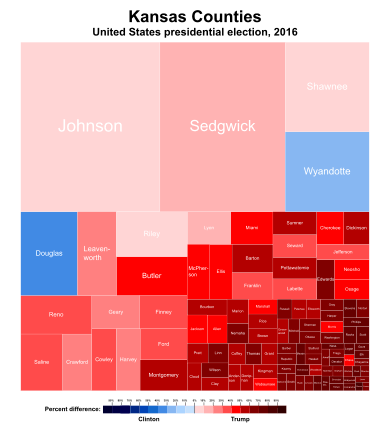
Treemap of the popular vote by county.
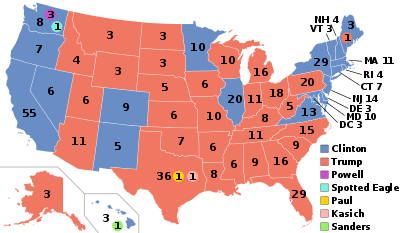
The 2016 United States presidential election in Kansas was held on November 8, 2016, as part of the 2016 General Election in which all 50 states plus The District of Columbia participated. Kansas voters chose electors to represent them in the Electoral College via a popular vote pitting the Republican Party's nominee, businessman Donald Trump, and running mate Indiana Governor Mike Pence against Democratic Party nominee, former Secretary of State Hillary Clinton and her running mate, Virginia Senator Tim Kaine.
On March 5, 2016, in the presidential primaries, voters expressed their preferences for the Democratic and Republican parties' respective nominees for president.
Donald Trump won the election in Kansas with 56.6% of the vote. Hillary Clinton received 36.0% of the vote.[1] Kansas was among the eleven states in which Hillary Clinton outperformed Barack Obama's margin in 2012 (though her percentage was lower than Obama's 38% of the vote), largely due to a significant shift towards Democrats in Johnson County.[2]
Background
The incumbent President of the United States, Barack Obama, a Democrat and former U.S. Senator from Illinois, was first elected president in the 2008 election, running with then-Senator Joe Biden of Delaware. Defeating the Republican nominee, Senator John McCain of Arizona, with 52.9% of the popular vote and 68% of the electoral vote,[3][4] Obama succeeded two-term Republican President George W. Bush, the former Governor of Texas. Obama and Biden were reelected in the 2012 presidential election, defeating former Massachusetts Governor Mitt Romney with 51.1% of the popular vote and 61.7% of electoral votes.[5] Although Barack Obama's approval rating in the RealClearPolitics poll tracking average remained between 40 and 50 percent for most of his second term, it has experienced a surge in early 2016 and reached its highest point since 2012 during June of that year.[6][7] Analyst Nate Cohn has noted that a strong approval rating for President Obama would equate to a strong performance for the Democratic candidate, and vice versa.[8]
Following his second term, President Obama is not eligible for another reelection. In October 2015, Obama's running-mate and two-term Vice President Biden decided not to enter the race for the Democratic presidential nomination either.[9] With their term expiring on January 20, 2017, the electorate is asked to elect a new president, the 45th president and 48th vice president of the United States, respectively.
Political landscape in Kansas
The state of Kansas has given its electoral votes to the Republican ticket since 1968, and only once to the Democrats (1964) since 1940. All current statewide officials are Republicans, as are all four members of the state's U.S. House delegation. Mitt Romney defeated Barack Obama by a margin of 60% to 38% in 2012. A poll conducted by John Zogby found Clinton leading Trump by 7 points in June.↵In addition, an internal poll for Representative Kevin Yoder, a Republican from Kansas' 3rd congressional district, released an internal poll showing Clinton leading Trump by 6 points in his district. This district voted for Mitt Romney by a 10-point margin in 2012 and has a PVI of R+6. This result, coupled with Clinton's gains in nationtional polls, caused Larry Sabato's Crystal Ball to move the Kansas race from "Safe Republican" to "Likely Republican" on August 18.[10]
Primary elections
Democratic caucuses

Results of the Democratic caucuses by Congressional District
Bernie Sanders
| Kansas Democratic caucuses, March 5, 2016 |
| Candidate |
District delegates |
Estimated delegates |
| Count |
Percentage |
Pledged |
Unpledged |
Total |
| Bernie Sanders |
26,637 |
67.90% |
23 |
0 |
23 |
| Hillary Clinton |
12,593 |
32.10% |
10 |
4 |
14 |
| Uncommitted |
N/A |
0 |
0 |
0 |
| Total |
39,230 |
100% |
33 |
4 |
37 |
| Source: The Green Papers |
Republican caucuses
Results of the Republican caucuses by Congressional District
Ted Cruz
| Kansas Republican precinct caucuses, March 5, 2016 |
| Candidate |
Votes |
Percentage |
Actual delegate count |
| Bound |
Unbound |
Total |
 Ted Cruz Ted Cruz |
37,512 |
47.50% |
24 |
0 |
24 |
| Donald Trump |
18,443 |
23.35% |
9 |
0 |
9 |
| Marco Rubio |
13,295 |
16.83% |
6 |
0 |
6 |
| John Kasich |
8,741 |
11.07% |
1 |
0 |
1 |
| Ben Carson (withdrawn) |
582 |
0.74% |
0 |
0 |
0 |
| Uncommitted |
279 |
0.35% |
0 |
0 |
0 |
| Jeb Bush (withdrawn) |
84 |
0.11% |
0 |
0 |
0 |
| Carly Fiorina (withdrawn) |
42 |
0.05% |
0 |
0 |
0 |
| Unprojected delegates: |
0 |
0 |
0 |
| Total: |
78,978 |
100.00% |
40 |
0 |
40 |
| Source: The Green Papers |
General election
Minor candidates
The following received write-in status:[11]
- President: Andrew D. Basiago; Vice President: Karen D. Kinnison
- President: Darrell L Castle; Vice President: Scott N. Bradley
- President: "Rocky" Roque De La Fuente, Vice President: Michael Steinberg
- President: Rocky Giordani; Vice President: Farley M Anderson
- President: James A Hedges; Vice President: Bill V Bayes
- President: Tom Hoefling; Vice President: Steve Schulin
- President: Lynn Kahn; Vice President: Kathy Monahan
- President: Gloria La Riva; Vice President: Eugene Puryer
- President: Michael S. Levinson; Vice President: Perry E. Wharton, II
- President: Michael A Maturen; Vice President: Juan A Munoz
- President: Evan McMullin; Vice President: Nathan D Johnson
- President: Monica G. Moorehead; Vice President: Lamont G. Lilly
- President: Darryl Perry; Vice President: Conan Salada
- President: Marshall R. Schoenke; Vice President: James C. Mitchell, Jr.
- President: Joe C Schriner; Vice President: Joe Moreaux
- President: Mike Smith; Vice President: Daniel White
By congressional district
Trump won 3 of the 4 congressional districts.[12]
By county
| County |
Clinton% |
Clinton# |
Trump% |
Trump# |
Others% |
Others# |
Total |
| Allen County | 26.27% | 1,433 | 66.94% | 3,651 | 6.78% | 370 | 5,454 |
| Anderson County | 20.06% | 672 | 72.69% | 2,435 | 7.25% | 243 | 3,350 |
| Atchison County | 30.25% | 1,989 | 61.58% | 4,049 | 8.17% | 537 | 6,575 |
| Barber County | 12.70% | 286 | 82.15% | 1,850 | 5.15% | 116 | 2,252 |
| Barton County | 17.91% | 1,839 | 76.82% | 7,888 | 5.27% | 541 | 10,268 |
| Bourbon County | 21.93% | 1,336 | 72.61% | 4,424 | 5.47% | 333 | 6,093 |
| Brown County | 21.38% | 863 | 72.00% | 2,906 | 6.62% | 267 | 4,036 |
| Butler County | 23.77% | 6,573 | 68.96% | 19,073 | 7.27% | 2,011 | 27,657 |
| Chase County | 23.08% | 316 | 70.78% | 969 | 6.14% | 84 | 1,369 |
| Chautauqua County | 13.30% | 197 | 83.46% | 1,236 | 3.24% | 48 | 1,481 |
| Cherokee County | 23.26% | 2,005 | 71.72% | 6,182 | 5.02% | 433 | 8,620 |
| Cheyenne County | 12.86% | 181 | 83.37% | 1,173 | 3.77% | 53 | 1,407 |
| Clark County | 11.94% | 120 | 82.09% | 825 | 5.97% | 60 | 1,005 |
| Clay County | 17.72% | 677 | 75.68% | 2,891 | 6.60% | 252 | 3,820 |
| Cloud County | 19.36% | 761 | 74.27% | 2,919 | 6.36% | 250 | 3,930 |
| Coffey County | 17.87% | 727 | 74.98% | 3,050 | 7.15% | 291 | 4,068 |
| Comanche County | 11.76% | 102 | 82.47% | 715 | 5.77% | 50 | 867 |
| Cowley County | 28.14% | 3,551 | 65.53% | 8,270 | 6.34% | 800 | 12,621 |
| Crawford County | 34.91% | 5,199 | 57.91% | 8,624 | 7.17% | 1,068 | 14,891 |
| Decatur County | 12.26% | 178 | 83.33% | 1,210 | 4.41% | 64 | 1,452 |
| Dickinson County | 19.60% | 1,609 | 73.43% | 6,029 | 6.97% | 572 | 8,210 |
| Doniphan County | 17.38% | 587 | 77.15% | 2,606 | 5.48% | 185 | 3,378 |
| Douglas County | 62.28% | 31,195 | 29.32% | 14,688 | 8.39% | 4,204 | 50,087 |
| Edwards County | 16.07% | 212 | 78.62% | 1,037 | 5.31% | 70 | 1,319 |
| Elk County | 12.71% | 160 | 83.24% | 1,048 | 4.05% | 51 | 1,259 |
| Ellis County | 22.95% | 2,742 | 70.86% | 8,466 | 6.19% | 739 | 11,947 |
| Ellsworth County | 19.45% | 521 | 73.50% | 1,969 | 7.05% | 189 | 2,679 |
| Finney County | 31.45% | 3,195 | 62.51% | 6,350 | 6.04% | 614 | 10,159 |
| Ford County | 27.84% | 2,149 | 66.26% | 5,114 | 5.90% | 455 | 7,718 |
| Franklin County | 26.37% | 2,892 | 65.53% | 7,185 | 8.10% | 888 | 10,965 |
| Geary County | 36.27% | 2,722 | 56.96% | 4,274 | 6.77% | 508 | 7,504 |
| Gove County | 11.09% | 149 | 84.88% | 1,140 | 4.02% | 54 | 1,343 |
| Graham County | 14.64% | 188 | 79.83% | 1,025 | 5.53% | 71 | 1,284 |
| Grant County | 18.46% | 441 | 75.51% | 1,804 | 6.03% | 144 | 2,389 |
| Gray County | 12.73% | 263 | 82.19% | 1,698 | 5.08% | 105 | 2,066 |
| Greeley County | 12.77% | 83 | 82.15% | 534 | 5.08% | 33 | 650 |
| Greenwood County | 17.08% | 485 | 76.06% | 2,160 | 6.87% | 195 | 2,840 |
| Hamilton County | 13.81% | 121 | 80.48% | 705 | 5.71% | 50 | 876 |
| Harper County | 15.24% | 393 | 77.42% | 1,996 | 7.33% | 189 | 2,578 |
| Harvey County | 33.98% | 5,068 | 58.11% | 8,668 | 7.91% | 1,180 | 14,916 |
| Haskell County | 18.09% | 245 | 76.81% | 1,040 | 5.10% | 69 | 1,354 |
| Hodgeman County | 12.19% | 124 | 84.07% | 855 | 3.74% | 38 | 1,017 |
| Jackson County | 25.99% | 1,512 | 67.70% | 3,939 | 6.31% | 367 | 5,818 |
| Jefferson County | 30.20% | 2,518 | 62.53% | 5,213 | 7.27% | 606 | 8,337 |
| Jewell County | 12.05% | 180 | 81.86% | 1,223 | 6.09% | 91 | 1,494 |
| Johnson County | 44.76% | 129,852 | 47.40% | 137,490 | 7.84% | 22,748 | 290,090 |
| Kearny County | 13.22% | 174 | 81.69% | 1,075 | 5.09% | 67 | 1,316 |
| Kingman County | 17.97% | 599 | 75.88% | 2,530 | 6.15% | 205 | 3,334 |
| Kiowa County | 10.57% | 114 | 83.41% | 900 | 6.02% | 65 | 1,079 |
| Labette County | 28.26% | 2,291 | 65.81% | 5,335 | 5.93% | 481 | 8,107 |
| Lane County | 12.17% | 106 | 82.43% | 718 | 5.40% | 47 | 871 |
| Leavenworth County | 33.69% | 10,209 | 58.21% | 17,638 | 8.10% | 2,454 | 30,301 |
| Lincoln County | 14.69% | 215 | 80.53% | 1,179 | 4.78% | 70 | 1,464 |
| Linn County | 16.63% | 736 | 78.70% | 3,484 | 4.68% | 207 | 4,427 |
| Logan County | 10.98% | 149 | 83.42% | 1,132 | 5.60% | 76 | 1,357 |
| Lyon County | 37.83% | 4,649 | 53.32% | 6,552 | 8.85% | 1,087 | 12,288 |
| Marion County | 21.41% | 1,204 | 71.18% | 4,003 | 7.41% | 417 | 5,624 |
| Marshall County | 22.94% | 1,072 | 70.77% | 3,307 | 6.29% | 294 | 4,673 |
| McPherson County | 25.32% | 3,226 | 67.09% | 8,549 | 7.59% | 967 | 12,742 |
| Meade County | 12.21% | 210 | 82.27% | 1,415 | 5.52% | 95 | 1,720 |
| Miami County | 26.57% | 3,991 | 66.59% | 10,003 | 6.84% | 1,028 | 15,022 |
| Mitchell County | 16.21% | 477 | 78.45% | 2,308 | 5.34% | 157 | 2,942 |
| Montgomery County | 21.97% | 2,637 | 72.30% | 8,679 | 5.73% | 688 | 12,004 |
| Morris County | 22.90% | 601 | 69.36% | 1,820 | 7.74% | 203 | 2,624 |
| Morton County | 12.33% | 147 | 83.47% | 995 | 4.19% | 50 | 1,192 |
| Nemaha County | 14.15% | 725 | 80.52% | 4,124 | 5.33% | 273 | 5,122 |
| Neosho County | 23.77% | 1,501 | 70.18% | 4,431 | 6.05% | 382 | 6,314 |
| Ness County | 11.14% | 162 | 84.46% | 1,228 | 4.40% | 64 | 1,454 |
| Norton County | 12.58% | 281 | 82.36% | 1,840 | 5.06% | 113 | 2,234 |
| Osage County | 24.88% | 1,753 | 68.49% | 4,826 | 6.63% | 467 | 7,046 |
| Osborne County | 13.03% | 233 | 81.66% | 1,460 | 5.31% | 95 | 1,788 |
| Ottawa County | 14.61% | 424 | 78.64% | 2,283 | 6.75% | 196 | 2,903 |
| Pawnee County | 21.76% | 579 | 71.55% | 1,904 | 6.69% | 178 | 2,661 |
| Phillips County | 11.26% | 300 | 83.82% | 2,233 | 4.92% | 131 | 2,664 |
| Pottawatomie County | 20.81% | 2,225 | 71.19% | 7,612 | 8.01% | 856 | 10,693 |
| Pratt County | 20.07% | 771 | 73.87% | 2,838 | 6.06% | 233 | 3,842 |
| Rawlins County | 11.07% | 163 | 82.88% | 1,220 | 6.05% | 89 | 1,472 |
| Reno County | 28.24% | 6,837 | 64.08% | 15,513 | 7.68% | 1,860 | 24,210 |
| Republic County | 14.83% | 375 | 80.03% | 2,024 | 5.14% | 130 | 2,529 |
| Rice County | 18.27% | 695 | 74.58% | 2,837 | 7.15% | 272 | 3,804 |
| Riley County | 43.38% | 9,341 | 46.94% | 10,107 | 9.68% | 2,084 | 21,532 |
| Rooks County | 11.37% | 275 | 83.96% | 2,031 | 4.67% | 113 | 2,419 |
| Rush County | 15.50% | 233 | 79.64% | 1,197 | 4.86% | 73 | 1,503 |
| Russell County | 14.44% | 461 | 80.61% | 2,574 | 4.95% | 158 | 3,193 |
| Saline County | 28.63% | 6,317 | 62.67% | 13,828 | 8.70% | 1,919 | 22,064 |
| Scott County | 10.72% | 236 | 84.70% | 1,865 | 4.59% | 101 | 2,202 |
| Sedgwick County | 36.88% | 69,627 | 55.28% | 104,353 | 7.84% | 14,803 | 188,783 |
| Seward County | 32.31% | 1,628 | 62.70% | 3,159 | 4.98% | 251 | 5,038 |
| Shawnee County | 44.99% | 33,926 | 47.65% | 35,934 | 7.35% | 5,546 | 75,406 |
| Sheridan County | 09.24% | 127 | 87.12% | 1,197 | 3.64% | 50 | 1,374 |
| Sherman County | 13.28% | 347 | 79.98% | 2,089 | 6.74% | 176 | 2,612 |
| Smith County | 14.54% | 297 | 81.34% | 1,661 | 4.11% | 84 | 2,042 |
| Stafford County | 16.03% | 304 | 78.59% | 1,490 | 5.38% | 102 | 1,896 |
| Stanton County | 18.05% | 115 | 77.24% | 492 | 4.71% | 30 | 637 |
| Stevens County | 11.63% | 220 | 84.56% | 1,599 | 3.81% | 72 | 1,891 |
| Sumner County | 21.35% | 2,076 | 71.84% | 6,984 | 6.81% | 662 | 9,722 |
| Thomas County | 13.23% | 473 | 81.32% | 2,908 | 5.45% | 195 | 3,576 |
| Trego County | 13.36% | 198 | 82.79% | 1,227 | 3.85% | 57 | 1,482 |
| Wabaunsee County | 22.96% | 776 | 70.18% | 2,372 | 6.86% | 232 | 3,380 |
| Wallace County | 05.76% | 46 | 90.35% | 721 | 3.88% | 31 | 798 |
| Washington County | 14.00% | 387 | 79.35% | 2,194 | 6.65% | 184 | 2,765 |
| Wichita County | 14.64% | 140 | 80.44% | 769 | 4.92% | 47 | 956 |
| Wilson County | 16.54% | 594 | 77.64% | 2,788 | 5.82% | 209 | 3,591 |
| Woodson County | 18.92% | 273 | 74.98% | 1,082 | 6.10% | 88 | 1,443 |
| Wyandotte County | 61.80% | 30,146 | 32.40% | 15,806 | 5.80% | 2,829 | 48,781 |
References
- ↑ "Kansas Election Results 2016 – The New York Times". Retrieved November 11, 2016.
- ↑ http://uselectionatlas.org/RESULTS/data.php?year=2016&def=swg&datatype=national&f=0&off=0&elect=0
- ↑ "United States House of Representatives floor summary for Jan 8, 2009". Clerk.house.gov. Retrieved January 30, 2009.
- ↑ "Federal elections 2008" (PDF). Federal Election Commission. Retrieved May 11, 2015.
- ↑ "President Map". The New York Times. November 29, 2012. Retrieved May 11, 2015.
- ↑ "Election Other – President Obama Job Approval". RealClearPolitics. Retrieved December 24, 2015.
- ↑ Byrnes, Jesse (2016-06-15). "Poll: Obama approval rating highest since 2012". TheHill. Retrieved 2016-06-19.
- ↑ Cohn, Nate (2015-01-19). "What a Rise in Obama's Approval Rating Means for 2016". The New York Times. ISSN 0362-4331. Retrieved 2016-06-19.
- ↑ "Joe Biden Decides Not to Enter Presidential Race". The Wall Street Journal. Retrieved October 21, 2015.
- ↑ Kondik, Kyle; Sabato, Larry; Skelley, Geoffrey. "Clinton Rises to 348 Electoral Votes, Trump Drops to 190". Sabato's Crystal Ball. University of Virginia Center for Politics. Retrieved 22 August 2016.
- ↑ http://www.sos.ks.gov/elections/16elec/2016_General_Election-Write-In_Presidential_Candidates.pdf
- ↑ http://www.swingstateproject.com/diary/4161/
External links
|
|---|
|
| Republican Party | |
|---|
| Democratic Party | |
|---|
| Libertarian Party | |
|---|
| Green Party | |
|---|
| Constitution Party | |
|---|
| Independent | |
|---|
|
|
|---|
| Election timelines | |
|---|
| National polling | |
|---|
| State polling | |
|---|
| Fundraising | |
|---|
| Debates and forums | |
|---|
| Straw polls | |
|---|
| Major events | |
|---|
Caucuses
and primaries | |
|---|
| Results breakdown | |
|---|
National
conventions | |
|---|
| Reforms | |
|---|
|
|---|
| Presidential (since 1832) | |
|---|
| Senatorial (since 1990) | |
|---|
| Gubernatorial (since 1990) | |
|---|
|
.jpg)