Stephenson County, Illinois
| Stephenson County, Illinois | |
|---|---|
 | |
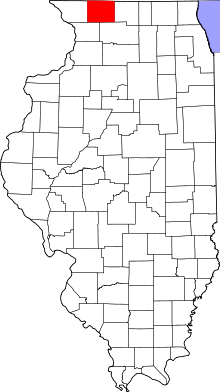 Location in the U.S. state of Illinois | |
 Illinois's location in the U.S. | |
| Founded | 1837 |
| Named for | Benjamin Stephenson |
| Seat | Freeport |
| Largest city | Freeport |
| Area | |
| • Total | 565 sq mi (1,463 km2) |
| • Land | 565 sq mi (1,463 km2) |
| • Water | 0.5 sq mi (1 km2), 0.09% |
| Population | |
| • (2010) | 47,711 |
| • Density | 85/sq mi (33/km2) |
| Congressional district | 17th |
| Time zone | Central: UTC−6/−5 |
| Website |
www |
Stephenson County is a county located in the U.S. state of Illinois. According to the 2010 census, it had a population of 47,711.[1] Its county seat is Freeport.[2]
Stephenson County is included in the Freeport, IL Micropolitan Statistical Area, which is also included in the Rockford-Freeport-Rochelle, IL Combined Statistical Area.
History
The land that became Stephenson County was first settled by William Waddams in 1832, who founded Waddams Grove.[3] Five years later in 1837, Stephenson County was formed out of Jo Daviess and Winnebago counties. The county was named for Colonel Benjamin Stephenson, an official of the Illinois Territory.[4]
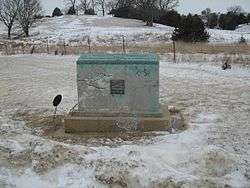 Today, this marker denotes the location of Waddams' first settlement in Stephenson County
 Stephenson County at the time of its creation in 1837
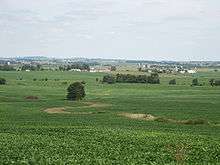
Geography
According to the U.S. Census Bureau, the county has a total area of 565 square miles (1,460 km2), of which 565 square miles (1,460 km2) is land and 0.5 square miles (1.3 km2) (0.09%) is water.[5]
Climate and weather
| Freeport, Illinois | ||||||||||||||||||||||||||||||||||||||||||||||||||||||||||||
|---|---|---|---|---|---|---|---|---|---|---|---|---|---|---|---|---|---|---|---|---|---|---|---|---|---|---|---|---|---|---|---|---|---|---|---|---|---|---|---|---|---|---|---|---|---|---|---|---|---|---|---|---|---|---|---|---|---|---|---|---|
| Climate chart (explanation) | ||||||||||||||||||||||||||||||||||||||||||||||||||||||||||||
| ||||||||||||||||||||||||||||||||||||||||||||||||||||||||||||
| ||||||||||||||||||||||||||||||||||||||||||||||||||||||||||||
In recent years the average temperatures in the county seat of Freeport, have ranged from a low of 9 °F (−13 °C) in January to a high of 82 °F (28 °C) in July, although a record low of −29 °F (−34 °C) was recorded in January 2009 and a record high of 101 °F (38 °C) was recorded in July 1988. Average monthly precipitation ranged from 1.33 inches (34 mm) in January to 4.46 inches (113 mm) in June.[6]
Adjacent counties
- Green County, Wisconsin (north)
- Winnebago County (east)
- Ogle County (southeast)
- Carroll County (southwest)
- Jo Daviess County (west)
- Lafayette County, Wisconsin (northwest)
Major highways
Demographics
| Historical population | |||
|---|---|---|---|
| Census | Pop. | %± | |
| 1840 | 2,800 | — | |
| 1850 | 11,666 | 316.6% | |
| 1860 | 25,112 | 115.3% | |
| 1870 | 30,608 | 21.9% | |
| 1880 | 31,963 | 4.4% | |
| 1890 | 31,338 | −2.0% | |
| 1900 | 34,933 | 11.5% | |
| 1910 | 36,821 | 5.4% | |
| 1920 | 37,743 | 2.5% | |
| 1930 | 40,064 | 6.1% | |
| 1940 | 40,646 | 1.5% | |
| 1950 | 41,595 | 2.3% | |
| 1960 | 46,207 | 11.1% | |
| 1970 | 48,861 | 5.7% | |
| 1980 | 49,536 | 1.4% | |
| 1990 | 48,052 | −3.0% | |
| 2000 | 48,979 | 1.9% | |
| 2010 | 47,711 | −2.6% | |
| Est. 2016 | 45,624 | [7] | −4.4% |
| U.S. Decennial Census[8] 1790-1960[9] 1900-1990[10] 1990-2000[11] 2010-2013[1] | |||
As of the 2010 United States Census, there were 47,711 people, 19,845 households, and 13,015 families residing in the county.[12] The population density was 84.5 inhabitants per square mile (32.6/km2). There were 22,081 housing units at an average density of 39.1 per square mile (15.1/km2).[5] The racial makeup of the county was 86.5% white, 9.0% black or African American, 0.6% Asian, 0.2% American Indian, 1.2% from other races, and 2.5% from two or more races. Those of Hispanic or Latino origin made up 2.9% of the population.[12] In terms of ancestry, 46.6% were German, 12.5% were Irish, 10.0% were English, and 8.0% were American.[13]
Of the 19,845 households, 28.6% had children under the age of 18 living with them, 50.3% were married couples living together, 11.2% had a female householder with no husband present, 34.4% were non-families, and 29.7% of all households were made up of individuals. The average household size was 2.36 and the average family size was 2.90. The median age was 43.1 years.[12]
The median income for a household in the county was $43,304 and the median income for a family was $54,224. Males had a median income of $41,672 versus $29,510 for females. The per capita income for the county was $22,608. About 12.3% of families and 14.8% of the population were below the poverty line, including 24.1% of those under age 18 and 7.3% of those age 65 or over.[14]
Education
There are five public high schools and one private high Schools in the county, enrollment figures, are included.
Public high schools
- Freeport High 1,254
- Lena-Winslow High 299
- Dakota High 254
- Pearl City High 150
- Orangeville High 142
Private high school
- Aquin Catholic High 93
Communities
City
Town
Villages
Census-designated place
Unincorporated communities
- Afolkey
- Bolton
- Buckhorn Corners
- Buena Vista
- Damascus
- Eleroy
- Evarts
- Florence
- Kent
- Loran
- McConnell
- Oneco
- Red Oak
- Rock Grove
- Scioto Mills
- Waddams Grove
- Winneshiek
Townships
Politics
| Year | Republican | Democratic | Third Parties |
|---|---|---|---|
| 2016 | 54.5% 11,083 | 38.2% 7,768 | 7.3% 1,492 |
| 2012 | 49.8% 10,512 | 48.1% 10,165 | 2.1% 451 |
| 2008 | 45.8% 9,909 | 52.4% 11,349 | 1.8% 399 |
| 2004 | 57.3% 12,212 | 41.8% 8,913 | 0.9% 195 |
| 2000 | 55.3% 10,715 | 41.6% 8,062 | 3.1% 601 |
| 1996 | 48.9% 8,871 | 39.4% 7,145 | 11.6% 2,109 |
| 1992 | 41.6% 9,005 | 36.5% 7,899 | 22.0% 4,752 |
| 1988 | 59.9% 11,342 | 39.4% 7,460 | 0.8% 143 |
| 1984 | 67.4% 14,237 | 31.8% 6,723 | 0.8% 171 |
| 1980 | 52.9% 10,779 | 30.4% 6,195 | 16.8% 3,414 |
| 1976 | 61.0% 11,678 | 37.6% 7,192 | 1.4% 267 |
| 1972 | 67.9% 13,584 | 32.0% 6,404 | 0.2% 31 |
| 1968 | 59.3% 11,821 | 35.3% 7,040 | 5.4% 1,067 |
| 1964 | 46.0% 9,252 | 54.0% 10,854 | 0.0% 0 |
| 1960 | 63.1% 13,872 | 36.6% 8,055 | 0.3% 68 |
| 1956 | 69.1% 14,245 | 30.8% 6,349 | 0.1% 20 |
| 1952 | 68.5% 14,446 | 31.3% 6,605 | 0.2% 35 |
| 1948 | 58.3% 10,564 | 40.9% 7,409 | 0.8% 149 |
| 1944 | 60.3% 11,948 | 39.1% 7,755 | 0.6% 118 |
| 1940 | 60.9% 14,040 | 38.7% 8,911 | 0.4% 94 |
| 1936 | 46.6% 9,943 | 49.5% 10,567 | 3.9% 832 |
| 1932 | 44.4% 8,963 | 53.1% 10,728 | 2.5% 507 |
| 1928 | 68.0% 11,992 | 31.6% 5,579 | 0.4% 72 |
| 1924 | 53.3% 8,638 | 15.1% 2,452 | 31.6% 5,126 |
| 1920 | 74.6% 9,570 | 21.6% 2,772 | 3.7% 479 |
| 1916 | 58.4% 8,620 | 37.0% 5,463 | 4.6% 681 |
| 1912 | 38.4% 3,476 | 42.5% 3,850 | 19.1% 1,734 |
| 1908 | 50.9% 4,605 | 45.1% 4,076 | 4.0% 360 |
| 1904 | 56.6% 4,876 | 38.0% 3,275 | 5.3% 460 |
| 1900 | 52.5% 4,677 | 44.7% 3,983 | 2.8% 250 |
| 1896 | 54.2% 4,728 | 43.3% 3,776 | 2.6% 225 |
| 1892 | 46.8% 3,574 | 48.6% 3,717 | 4.6% 352 |
See also
Notes
- 1 2 "State & County QuickFacts". United States Census Bureau. Retrieved July 8, 2014.
- ↑ "Find a County". National Association of Counties. Retrieved 2011-06-07.
- ↑ "Historical News". Journal of the Illinois State Historical Society (1908-1984). 27 (3): 347. October 1934.
- ↑ "Fifteenth Judicial Circuit". State of Illinois. Retrieved 2016-02-20.
- 1 2 "Population, Housing Units, Area, and Density: 2010 - County". United States Census Bureau. Retrieved 2015-07-12.
- 1 2 "Monthly Averages for Freeport, Illinois". The Weather Channel. Retrieved 2011-01-27.
- ↑ "Population and Housing Unit Estimates". Retrieved June 9, 2017.
- ↑ "U.S. Decennial Census". United States Census Bureau. Retrieved July 8, 2014.
- ↑ "Historical Census Browser". University of Virginia Library. Retrieved July 8, 2014.
- ↑ "Population of Counties by Decennial Census: 1900 to 1990". United States Census Bureau. Retrieved July 8, 2014.
- ↑ "Census 2000 PHC-T-4. Ranking Tables for Counties: 1990 and 2000" (PDF). United States Census Bureau. Retrieved July 8, 2014.
- 1 2 3 "DP-1 Profile of General Population and Housing Characteristics: 2010 Demographic Profile Data". United States Census Bureau. Retrieved 2015-07-12.
- ↑ "DP02 SELECTED SOCIAL CHARACTERISTICS IN THE UNITED STATES – 2006-2010 American Community Survey 5-Year Estimates". United States Census Bureau. Retrieved 2015-07-12.
- ↑ "DP03 SELECTED ECONOMIC CHARACTERISTICS – 2006-2010 American Community Survey 5-Year Estimates". United States Census Bureau. Retrieved 2015-07-12.
- ↑ Leip, David. "Dave Leip's Atlas of U.S. Presidential Elections". uselectionatlas.org.
References
External links
- Stephenson County
- Benjamin Stephenson House Restoration Project
- Stephenson County Historical Society & Museum
- Freeport/Stephenson County Convention and Visitors Bureau
- Illinois Ancestors Stephenson Tombstone Project
- Genealogy Trails for Stephenson County
Places adjacent to Stephenson County, Illinois | ||||||||||
|---|---|---|---|---|---|---|---|---|---|---|
| ||||||||||
Municipalities and communities of Stephenson County, Illinois, United States | ||
|---|---|---|
| City | ||
| Town | ||
| Villages | ||
| CDP | ||
| Townships | ||
| Unincorporated communities |
| |
| Footnotes | ‡This populated place also has portions in an adjacent county or counties | |
