Mason County, Illinois
| Mason County, Illinois | |
|---|---|
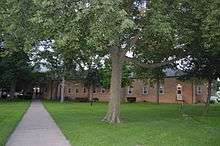 Mason County Courthouse, Havana | |
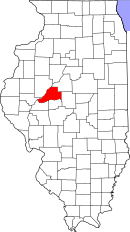 Location in the U.S. state of Illinois | |
 Illinois's location in the U.S. | |
| Founded | 1841 |
| Named for | George Mason |
| Seat | Havana |
| Largest city | Havana |
| Area | |
| • Total | 563 sq mi (1,458 km2) |
| • Land | 539 sq mi (1,396 km2) |
| • Water | 24 sq mi (62 km2), 4.3% |
| Population | |
| • (2010) | 14,666 |
| • Density | 27/sq mi (10/km2) |
| Congressional district | 18th |
| Time zone | Central: UTC−6/−5 |
| Website |
www |
Mason County is a county in the U.S. state of Illinois. According to the 2010 census, it had a population of 14,666.[1] Its county seat is Havana.[2] The county is named in honor of George Mason, a member of the Virginia legislature who campaigned for the adoption of the United States Bill of Rights.
History
Mason County was created in 1841 out of portions of Tazewell and Menard counties.
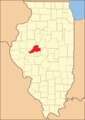 Mason County at the time of its creation in 1841
Geography
According to the U.S. Census Bureau, the county has an area of 563 square miles (1,460 km2), of which 539 square miles (1,400 km2) is land and 24 square miles (62 km2) (4.3%) is water.[3]
Mason County is bound on the south by the Sangamon River, and on the west by the Illinois River. These rivers join at the county's southwest tip.
The soil covering much of Mason County is very sandy. This was formed during the melting of the Wisconsin Glacier about 10,000 years ago. Meltwater from the glacier deposited large amounts of sand in a delta region near at the junction of the Sangamon and Illinois Rivers.
The sandy soil does not hold water well, quickly exposing crops to drought conditions as the water table drops during periods of low precipitation. However, the soil is very good for growing vegetables that are otherwise not common in Illinois. Modern irrigation has made this a highly productive agricultural area.
A sand wetland on the Illinois River is managed by the U.S. Fish and Wildlife Service as the Chautauqua National Wildlife Refuge.
Climate and weather
| Havana, Illinois | ||||||||||||||||||||||||||||||||||||||||||||||||||||||||||||
|---|---|---|---|---|---|---|---|---|---|---|---|---|---|---|---|---|---|---|---|---|---|---|---|---|---|---|---|---|---|---|---|---|---|---|---|---|---|---|---|---|---|---|---|---|---|---|---|---|---|---|---|---|---|---|---|---|---|---|---|---|
| Climate chart (explanation) | ||||||||||||||||||||||||||||||||||||||||||||||||||||||||||||
| ||||||||||||||||||||||||||||||||||||||||||||||||||||||||||||
| ||||||||||||||||||||||||||||||||||||||||||||||||||||||||||||
In recent years, average temperatures in the county seat of Havana have ranged from a low of 14 °F (−10 °C) in January to a high of 88 °F (31 °C) in July, although a record low of −30 °F (−34 °C) was recorded in January 1999 and a record high of 106 °F (41 °C) was recorded in July 1983. Average monthly precipitation ranged from 1.85 inches (47 mm) in January to 4.43 inches (113 mm) in May.[4]
Major highways
Adjacent counties
- Fulton County - north
- Tazewell County - northeast
- Logan County - southeast
- Menard County - south
- Cass County - southwest
- Schuyler County - west
National protected area
Demographics
| Historical population | |||
|---|---|---|---|
| Census | Pop. | %± | |
| 1850 | 5,921 | — | |
| 1860 | 10,931 | 84.6% | |
| 1870 | 16,184 | 48.1% | |
| 1880 | 16,242 | 0.4% | |
| 1890 | 16,067 | −1.1% | |
| 1900 | 17,491 | 8.9% | |
| 1910 | 17,377 | −0.7% | |
| 1920 | 16,634 | −4.3% | |
| 1930 | 15,115 | −9.1% | |
| 1940 | 15,358 | 1.6% | |
| 1950 | 15,326 | −0.2% | |
| 1960 | 15,193 | −0.9% | |
| 1970 | 16,161 | 6.4% | |
| 1980 | 19,492 | 20.6% | |
| 1990 | 16,269 | −16.5% | |
| 2000 | 16,038 | −1.4% | |
| 2010 | 14,666 | −8.6% | |
| Est. 2016 | 13,507 | [5] | −7.9% |
| U.S. Decennial Census[6] 1790-1960[7] 1900-1990[8] 1990-2000[9] 2010-2013[1] | |||
As of the 2010 United States Census, there were 14,666 people, 6,079 households, and 4,060 families residing in the county.[10] The population density was 27.2 inhabitants per square mile (10.5/km2). There were 7,077 housing units at an average density of 13.1 per square mile (5.1/km2).[3] The racial makeup of the county was 98.1% white, 0.4% black or African American, 0.3% Asian, 0.2% American Indian, 0.1% from other races, and 0.9% from two or more races. Those of Hispanic or Latino origin made up 0.8% of the population.[10] In terms of ancestry, 33.8% were German, 15.6% were American, 11.1% were English, and 10.3% were Irish.[11]
Of the 6,079 households, 28.9% had children under the age of 18 living with them, 52.1% were married couples living together, 10.3% had a female householder with no husband present, 33.2% were non-families, and 28.4% of all households were made up of individuals. The average household size was 2.38 and the average family size was 2.87. The median age was 44.0 years.[10]
The median income for a household in the county was $42,461 and the median income for a family was $51,348. Males had a median income of $43,448 versus $31,087 for females. The per capita income for the county was $23,427. About 13.8% of families and 15.2% of the population were below the poverty line, including 23.6% of those under age 18 and 7.5% of those age 65 or over.[12]
Communities
Cities
Town
Villages
Census-designated place
Other unincorporated communities
- Biggs
- Bishop
- Matanzas Beach
- Natrona
- Poplar City
- Saidora
- Snicarte
- Teheran
- Union
Townships
Politics
| Year | Republican | Democratic | Third Parties |
|---|---|---|---|
| 2016 | 62.5% 4,058 | 31.0% 2,014 | 6.5% 421 |
| 2012 | 51.9% 3,265 | 45.5% 2,867 | 2.6% 164 |
| 2008 | 46.0% 3,141 | 51.9% 3,542 | 2.2% 148 |
| 2004 | 54.4% 3,907 | 44.8% 3,215 | 0.9% 61 |
| 2000 | 50.4% 3,411 | 47.1% 3,192 | 2.5% 169 |
| 1996 | 37.7% 2,430 | 52.5% 3,385 | 9.8% 629 |
| 1992 | 32.1% 2,473 | 51.5% 3,969 | 16.4% 1,260 |
| 1988 | 50.0% 3,424 | 49.7% 3,406 | 0.4% 25 |
| 1984 | 54.9% 4,109 | 44.8% 3,354 | 0.3% 23 |
| 1980 | 60.4% 4,644 | 34.8% 2,680 | 4.8% 369 |
| 1976 | 49.0% 3,847 | 50.3% 3,947 | 0.7% 55 |
| 1972 | 62.7% 4,897 | 37.1% 2,901 | 0.2% 12 |
| 1968 | 49.7% 3,899 | 42.9% 3,365 | 7.5% 589 |
| 1964 | 36.8% 2,833 | 63.2% 4,857 | |
| 1960 | 53.0% 4,337 | 46.8% 3,824 | 0.2% 19 |
| 1956 | 59.3% 4,677 | 40.6% 3,199 | 0.2% 13 |
| 1952 | 61.9% 4,982 | 38.0% 3,061 | 0.1% 4 |
| 1948 | 49.8% 3,525 | 49.5% 3,503 | 0.7% 46 |
| 1944 | 54.5% 3,959 | 45.2% 3,282 | 0.3% 21 |
| 1940 | 50.5% 4,541 | 49.1% 4,416 | 0.5% 41 |
| 1936 | 38.9% 3,395 | 60.5% 5,278 | 0.7% 58 |
| 1932 | 30.7% 2,551 | 68.5% 5,681 | 0.8% 68 |
| 1928 | 54.8% 3,956 | 45.0% 3,246 | 0.3% 19 |
| 1924 | 52.7% 3,522 | 38.0% 2,536 | 9.3% 622 |
| 1920 | 58.4% 3,842 | 39.4% 2,595 | 2.2% 142 |
| 1916 | 42.4% 3,029 | 54.4% 3,886 | 3.1% 224 |
| 1912 | 23.0% 948 | 52.7% 2,173 | 24.3% 1,000 |
| 1908 | 43.5% 1,924 | 51.2% 2,264 | 5.3% 236 |
| 1904 | 45.0% 1,798 | 45.2% 1,806 | 9.7% 388 |
| 1900 | 43.7% 2,027 | 54.1% 2,508 | 2.2% 101 |
| 1896 | 45.8% 2,100 | 52.5% 2,407 | 1.6% 75 |
| 1892 | 40.0% 1,614 | 54.8% 2,211 | 5.2% 209 |
Although it voted for the Whig Party in the three elections from 1840 to 1848, Mason County was to be solidly Democratic for the next sixty to seventy years due to its anti-Yankee German-American heritage. It was not until the 1920 election when bitter resentment was felt by German-Americans at Woodrow Wilson’s postwar policies that Mason supported a GOP candidate.
In the following eighty years, Mason was a Republican-leaning swing county, although isolationist sentiment did cause it to vote narrowly for Wendell Willkie in 1940 and more convincingly for Thomas E. Dewey in 1944. The past decade or so has seen Mason turn solidly Republican due to opposition to the Democratic Party’s social liberalism and concern over the lack of employment and other economic opportunities in the “Rust Belt” – whose edge Mason County lies on.
See also
References
- 1 2 "State & County QuickFacts". United States Census Bureau. Archived from the original on July 14, 2011. Retrieved July 7, 2014.
- ↑ "Find a County". National Association of Counties. Archived from the original on 2011-05-31. Retrieved 2011-06-07.
- 1 2 "Population, Housing Units, Area, and Density: 2010 - County". United States Census Bureau. Retrieved 2015-07-12.
- 1 2 "Monthly Averages for Havana, Illinois". The Weather Channel. Archived from the original on 2012-10-23. Retrieved 2011-01-27.
- ↑ "Population and Housing Unit Estimates". Archived from the original on May 29, 2017. Retrieved June 9, 2017.
- ↑ "U.S. Decennial Census". United States Census Bureau. Archived from the original on May 12, 2015. Retrieved July 7, 2014.
- ↑ "Historical Census Browser". University of Virginia Library. Archived from the original on August 16, 2012. Retrieved July 7, 2014.
- ↑ "Population of Counties by Decennial Census: 1900 to 1990". United States Census Bureau. Archived from the original on April 24, 2014. Retrieved July 7, 2014.
- ↑ "Census 2000 PHC-T-4. Ranking Tables for Counties: 1990 and 2000" (PDF). United States Census Bureau. Archived (PDF) from the original on December 18, 2014. Retrieved July 7, 2014.
- 1 2 3 "DP-1 Profile of General Population and Housing Characteristics: 2010 Demographic Profile Data". United States Census Bureau. Retrieved 2015-07-12.
- ↑ "DP02 SELECTED SOCIAL CHARACTERISTICS IN THE UNITED STATES – 2006-2010 American Community Survey 5-Year Estimates". United States Census Bureau. Retrieved 2015-07-12.
- ↑ "DP03 SELECTED ECONOMIC CHARACTERISTICS – 2006-2010 American Community Survey 5-Year Estimates". United States Census Bureau. Retrieved 2015-07-12.
- ↑ Leip, David. "Dave Leip's Atlas of U.S. Presidential Elections". uselectionatlas.org. Archived from the original on 23 March 2018. Retrieved 30 April 2018.
Places adjacent to Mason County, Illinois | ||||||||||
|---|---|---|---|---|---|---|---|---|---|---|
| ||||||||||
Municipalities and communities of Mason County, Illinois, United States | ||
|---|---|---|
| Cities | ||
| Town | ||
| Villages | ||
| Townships | ||
| CDP | ||
| Other unincorporated communities |
| |
| Footnotes | ‡This populated place also has portions in an adjacent county or counties | |
