United States presidential election in Pennsylvania, 2016
|
|
|
| Turnout |
70.11%  [1] [1] |
|---|
|
|
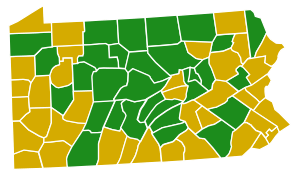
 County Results
|
Trump
40–50%
50–60%
60–70%
70–80%
80–90%
|
Clinton
40–50%
50–60%
80–90%
|
|
|
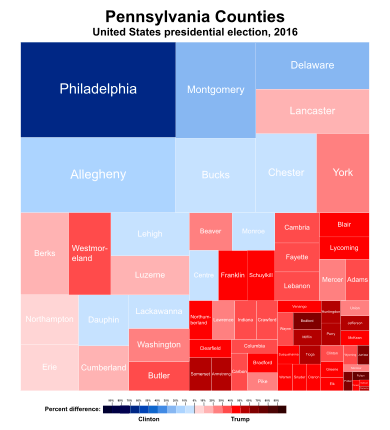
Treemap of the popular vote by county.
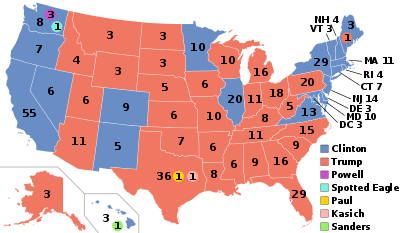
The 2016 United States presidential election in Pennsylvania took place on November 8, 2016, as part of the 2016 general election in which all fifty states and the District of Columbia participated. Pennsylvania voters chose electors to represent them in the Electoral College via a popular vote.
On April 26, 2016, in the presidential primaries, voters selected the Democratic, Republican, and Green parties' respective nominees for president. Pennsylvania is a closed primary state, meaning voters must have been previously registered with a particular political party in order to vote for one of that parties' candidates, to participate in their respective party primary.[2]
The Republican party candidate, who became their nominee following the primary, Donald Trump, won Pennsylvania by 44,292 votes out of more than six million cast, a difference of 0.72% and the narrowest margin in a presidential election for the state in 176 years, since 1840 when William Henry Harrison defeated Martin Van Buren by just 0.12%.
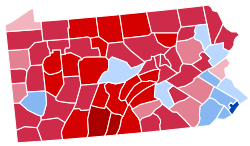
Prior to the election, Pennsylvania was expected to be close, but narrowly go to Clinton [3]. On election day, Pennsylvania swung to Donald Trump, gaining almost 300,000 votes over Mitt Romney. Donald Trump carried 56 of the state's 67 counties, predominantly rural or semi-rural counties, while Clinton carried much of the Philadelphia metropolitan area as well as other cities including Pittsburgh, Harrisburg and Scranton. Nonetheless, some areas of traditional Democratic strength such as Luzerne County, where Wilkes-Barre is located, saw swings in margins of up to 25% toward Donald Trump, making him the first Republican candidate for president to carry Pennsylvania since George H. W. Bush in 1988.
Primaries
Democratic primary
Results of the Democratic primary by county.
Hillary Clinton
Bernie Sanders
Republican primary
Republican primary results by county.
Donald Trump
| Pennsylvania Republican primary, April 26, 2016 |
| Candidate |
Votes |
Percentage |
Actual delegate count |
| Bound |
Unbound |
Total |
| Donald Trump |
902,593 |
56.61% |
17 |
42 |
59 |
| Ted Cruz |
345,506 |
21.67% |
0 |
4 |
4 |
| John Kasich |
310,003 |
19.44% |
0 |
3 |
3 |
| Ben Carson (withdrawn) |
14,842 |
0.93% |
0 |
0 |
0 |
| Marco Rubio (withdrawn) |
11,954 |
0.75% |
0 |
0 |
0 |
| Jeb Bush (withdrawn) |
9,577 |
0.60% |
0 |
0 |
0 |
| Unprojected delegates: |
0 |
5 |
5 |
| Total: |
1,594,475 |
100.00% |
17 |
54 |
71 |
| Source: The Green Papers |
Green Party
Pennsylvania held a series of caucuses throughout April, culminating with a meeting on April 30 in Harrisburg, Pennsylvania, where delegates were assigned.[4][5]
| Pennsylvania Green Party presidential caucuses, April 17, 2016 |
| Candidate |
Votes |
Percentage |
National delegates |
 Jill Stein Jill Stein |
- |
- |
8 |
| William Kreml |
- |
- |
1 |
| Sedinam Kinamo Christin Moyowasifza Curry |
- |
- |
- |
| Darryl Cherney |
- |
- |
- |
| Kent Mesplay |
- |
- |
- |
| Total |
- |
100.00% |
9 |
Democratic National Convention
From July 25 to July 28, 2016, Philadelphia hosted the 2016 Democratic National Convention. It was held at the Wells Fargo Center with ancillary meetings at the Pennsylvania Convention Center. Former Secretary of State Hillary Clinton was elected as the party's nominee for president by a 59.67% majority of delegates present at the convention roll call, defeating primary rival Senator Bernie Sanders, who received 39.16% of votes from delegates, and becoming the first female candidate to be formally nominated by a major national party as a presidential candidate in the United States. Her running mate, Senator Tim Kaine, the junior United States Senator from Virginia for only 3 years at the time, and largely unheard of at the national level, was chosen by delegates as the party's nominee for vice president by acclamation.
It was later shown that key executives on the Democratic National Party leadership team inappropriately stymied Bernie Sanders' efforts, tipping the scales in favor of Clinton. That, combined with the statement from Tom Perez, the chair of the Democratic National committee, that Democrats who oppose abortion were not welcome in the party caused a significant division within the Democratic party following the primaries. The Democratic party platform was amended during the 2016 election, to unambiguously state that women have a “right to safe and legal abortion” and promises that the party will oppose and work to overturn “laws and policies that impede a woman’s access to abortion.”
General election
Statewide results
| United States presidential election in Pennsylvania, 2016 |
| Party |
Candidate |
Running mate |
Votes |
Percentage |
Electoral votes |
|
Republican |
Donald Trump |
Mike Pence |
2,970,733 |
48.18% |
20 |
|
Democratic |
Hillary Clinton |
Tim Kaine |
2,926,441 |
47.46% |
0 |
|
Libertarian |
Gary Johnson |
William Weld |
146,715 |
2.38% |
0 |
|
Green |
Jill Stein |
Ajamu Baraka |
49,941 |
0.81% |
0 |
|
Constitution |
Darrell Castle |
Scott Bradley |
21,572 |
0.35% |
0 |
|
Others / Write-In Votes |
|
|
50,076 |
0.81% |
0 |
| Totals |
6,165,478 |
100.00% |
20 |
| Voter turnout (Voting age population) |
60.27% |
| Source: Pennsylvania Department of State |
By congressional district
Trump won 12 of 18 congressional districts, including the 17th district which elected a Democrat.[6]
By county
| County |
Clinton% |
Clinton# |
Trump% |
Trump# |
Others% |
Others# |
Total |
| Adams | 29.94% | 14,219 | 66.17% | 31,423 | 3.89% | 1,847 | 47,489 |
| Allegheny | 56.55% | 367,617 | 39.91% | 259,480 | 3.54% | 23,017 | 650,114 |
| Armstrong | 22.70% | 7,178 | 74.27% | 23,484 | 3.02% | 956 | 31,618 |
| Beaver | 38.93% | 32,531 | 57.64% | 48,167 | 3.44% | 2,873 | 83,571 |
| Bedford | 15.42% | 3,645 | 82.72% | 19,552 | 1.86% | 440 | 23,637 |
| Berks | 42.85% | 78,437 | 52.78% | 96,626 | 4.37% | 8,002 | 183,065 |
| Blair | 25.42% | 13,958 | 71.27% | 39,135 | 3.31% | 1,816 | 54,909 |
| Bradford | 24.77% | 6,369 | 70.57% | 18,141 | 4.66% | 1,198 | 25,708 |
| Bucks | 48.52% | 167,060 | 47.74% | 164,361 | 3.74% | 12,876 | 344,297 |
| Butler | 29.45% | 28,584 | 66.37% | 64,428 | 4.18% | 4,059 | 97,071 |
| Cambria | 29.91% | 18,867 | 67.00% | 42,258 | 3.09% | 1,947 | 63,072 |
| Cameron | 24.29% | 531 | 72.69% | 1,589 | 3.02% | 66 | 2,186 |
| Carbon | 31.05% | 8,936 | 65.13% | 18,743 | 3.81% | 1,097 | 28,776 |
| Centre | 48.71% | 37,088 | 46.32% | 35,274 | 4.97% | 3,786 | 76,148 |
| Chester | 52.71% | 141,682 | 43.20% | 116,114 | 4.09% | 11,004 | 268,800 |
| Clarion | 24.37% | 4,273 | 71.72% | 12,576 | 3.91% | 686 | 17,535 |
| Clearfield | 23.93% | 8,200 | 72.75% | 24,932 | 3.32% | 1,139 | 34,271 |
| Clinton | 30.82% | 4,744 | 65.10% | 10,022 | 4.08% | 628 | 15,394 |
| Columbia | 31.65% | 8,934 | 63.78% | 18,004 | 4.57% | 1,290 | 28,228 |
| Crawford | 29.26% | 10,971 | 66.65% | 24,987 | 4.09% | 1,534 | 37,492 |
| Cumberland | 38.72% | 47,085 | 56.80% | 69,076 | 4.49% | 5,456 | 121,617 |
| Dauphin | 49.44% | 64,706 | 46.51% | 60,863 | 4.05% | 5,303 | 130,872 |
| Delaware | 59.60% | 177,402 | 37.18% | 110,667 | 3.21% | 9,565 | 297,634 |
| Elk | 26.71% | 3,853 | 69.49% | 10,025 | 3.80% | 548 | 14,426 |
| Erie | 46.99% | 58,112 | 48.57% | 60,069 | 4.45% | 5,498 | 123,679 |
| Fayette | 33.38% | 17,946 | 64.33% | 34,590 | 2.29% | 1,231 | 53,767 |
| Forest | 26.07% | 626 | 70.10% | 1,683 | 3.83% | 92 | 2,401 |
| Franklin | 25.05% | 17,465 | 71.37% | 49,768 | 3.58% | 2,498 | 69,731 |
| Fulton | 13.47% | 912 | 84.09% | 5,694 | 2.44% | 165 | 6,771 |
| Greene | 28.43% | 4,482 | 68.82% | 10,849 | 2.75% | 433 | 15,764 |
| Huntingdon | 23.03% | 4,539 | 73.55% | 14,494 | 3.42% | 673 | 19,706 |
| Indiana | 30.52% | 11,528 | 65.89% | 24,888 | 3.58% | 1,354 | 37,770 |
| Jefferson | 18.74% | 3,650 | 78.00% | 15,192 | 3.27% | 636 | 19,478 |
| Juniata | 17.42% | 1,821 | 79.14% | 8,273 | 3.44% | 360 | 10,454 |
| Lackawanna | 50.25% | 51,983 | 46.77% | 48,384 | 2.99% | 3,089 | 103,456 |
| Lancaster | 37.78% | 91,093 | 57.20% | 137,914 | 5.02% | 12,105 | 241,112 |
| Lawrence | 34.38% | 14,009 | 62.40% | 25,428 | 3.23% | 1,316 | 40,753 |
| Lebanon | 30.65% | 18,953 | 65.53% | 40,525 | 3.83% | 2,367 | 61,845 |
| Lehigh | 50.51% | 81,324 | 45.77% | 73,690 | 3.71% | 5,979 | 160,993 |
| Luzerne | 38.86% | 52,451 | 58.29% | 78,688 | 2.85% | 3,844 | 134,983 |
| Lycoming | 25.75% | 13,020 | 70.46% | 35,627 | 3.79% | 1,918 | 50,565 |
| McKean | 24.70% | 4,025 | 71.40% | 11,635 | 3.90% | 636 | 16,296 |
| Mercer | 35.81% | 18,733 | 60.30% | 31,544 | 3.88% | 2,032 | 52,309 |
| Mifflin | 20.84% | 3,877 | 75.77% | 14,094 | 3.39% | 630 | 18,601 |
| Monroe | 48.63% | 33,918 | 47.86% | 33,386 | 3.51% | 2,448 | 69,752 |
| Montgomery | 58.91% | 256,082 | 37.44% | 162,731 | 3.65% | 15,874 | 434,687 |
| Montour | 33.39% | 2,857 | 61.80% | 5,288 | 4.80% | 411 | 8,556 |
| Northampton | 46.18% | 66,272 | 49.98% | 71,736 | 3.84% | 5,511 | 143,519 |
| Northumberland | 26.73% | 9,788 | 69.43% | 25,427 | 3.84% | 1,407 | 36,622 |
| Perry | 21.89% | 4,632 | 73.81% | 15,616 | 4.30% | 910 | 21,158 |
| Philadelphia | 82.53% | 584,025 | 15.37% | 108,748 | 2.10% | 14,858 | 707,631 |
| Pike | 35.46% | 9,256 | 61.51% | 16,056 | 3.02% | 789 | 26,101 |
| Potter | 16.73% | 1,302 | 80.31% | 6,251 | 2.97% | 231 | 7,784 |
| Schuylkill | 26.67% | 16,770 | 69.99% | 44,001 | 3.34% | 2,098 | 62,869 |
| Snyder | 24.46% | 4,002 | 71.66% | 11,725 | 3.89% | 636 | 16,363 |
| Somerset | 20.62% | 7,376 | 76.54% | 27,379 | 2.85% | 1,018 | 35,773 |
| Sullivan | 23.92% | 750 | 73.05% | 2,291 | 3.03% | 95 | 3,136 |
| Susquehanna | 27.16% | 5,123 | 68.34% | 12,891 | 4.50% | 849 | 18,863 |
| Tioga | 21.29% | 3,901 | 74.29% | 13,614 | 4.42% | 810 | 18,325 |
| Union | 35.38% | 6,180 | 60.81% | 10,622 | 3.81% | 666 | 17,468 |
| Venango | 27.02% | 6,309 | 68.62% | 16,021 | 4.36% | 1,018 | 23,348 |
| Warren | 27.91% | 5,145 | 67.68% | 12,477 | 4.40% | 812 | 18,434 |
| Washington | 35.80% | 36,322 | 60.51% | 61,386 | 3.69% | 3,742 | 101,450 |
| Wayne | 29.18% | 7,008 | 67.63% | 16,244 | 3.19% | 766 | 24,018 |
| Westmoreland | 32.78% | 59,669 | 64.01% | 116,522 | 3.22% | 5,860 | 182,051 |
| Wyoming | 28.99% | 3,811 | 67.23% | 8,837 | 3.77% | 496 | 13,144 |
| York | 33.27% | 68,524 | 62.40% | 128,528 | 4.34% | 8,934 | 205,986 |
Counties that swung from Democratic to Republican
Counties that swung from Republican to Democratic
External links
|
|---|
|
| Republican Party | |
|---|
| Democratic Party | |
|---|
| Libertarian Party | |
|---|
| Green Party | |
|---|
| Constitution Party | |
|---|
| Independent | |
|---|
|
|
|---|
| Election timelines | |
|---|
| National polling | |
|---|
| State polling | |
|---|
| Fundraising | |
|---|
| Debates and forums | |
|---|
| Straw polls | |
|---|
| Major events | |
|---|
Caucuses
and primaries | |
|---|
| Results breakdown | |
|---|
National
conventions | |
|---|
| Reforms | |
|---|
.jpg)