United States presidential election in South Dakota, 2016
|
| |||||||||||||||||||||||||||||||||
| |||||||||||||||||||||||||||||||||
| Turnout | 69.62% | ||||||||||||||||||||||||||||||||
|---|---|---|---|---|---|---|---|---|---|---|---|---|---|---|---|---|---|---|---|---|---|---|---|---|---|---|---|---|---|---|---|---|---|
| |||||||||||||||||||||||||||||||||
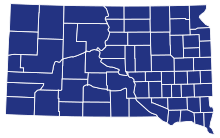
 County Results
| |||||||||||||||||||||||||||||||||
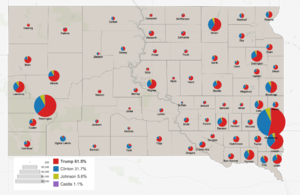 Results by county showing number of votes by size and candidates by color | |||||||||||||||||||||||||||||||||
| |||||||||||||||||||||||||||||||||
.jpg)


| Elections in South Dakota |
|---|
 |
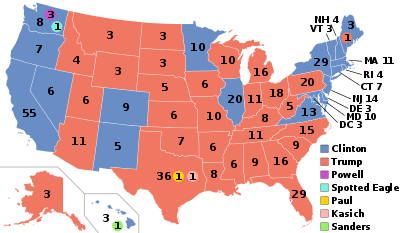
The 2016 United States presidential election in South Dakota was held on November 8, 2016, as part of the 2016 General Election in which all 50 states plus The District of Columbia participated. South Dakota voters chose electors to represent them in the Electoral College via a popular vote pitting the Republican Party's nominee, businessman Donald Trump, and running mate Indiana Governor Mike Pence against Democratic Party nominee, former Secretary of State Hillary Clinton and her running mate, Virginia Senator Tim Kaine.
South Dakota has voted for the Republican ticket in every election since 1968. Donald Trump continued the Republican tradition in South Dakota, carrying the state with 61.5% of the vote, to Hillary Clinton's 31.7% of the vote,[1] a 29.8% margin of victory, the largest for either party candidate since Republican Dwight D. Eisenhower's 38.5% margin in 1952. South Dakota was also Libertarian Party candidate Gary Johnson's fifth strongest state in the 2016 election, which his 5.63% in popular vote being only behind New Mexico, North Dakota, Alaska and Oklahoma[2].
Primary elections
Democratic primary
Five candidates appeared on the Democratic presidential primary ballot:
| South Dakota Democratic primary, June 7, 2016 | |||||
|---|---|---|---|---|---|
| Candidate | Popular vote | Estimated delegates | |||
| Count | Percentage | Pledged | Unpledged | Total | |
| Hillary Clinton | 27,047 | 51.03% | 10 | 2 | 12 |
| Bernie Sanders | 25,959 | 48.97% | 10 | 0 | 10 |
| Uncommitted | N/A | 0 | 3 | 3 | |
| Total | 53,006 | 100% | 20 | 5 | 25 |
| Source: The Green Papers, South Dakota Secretary of State - Official Primary Results | |||||
Republican primary
Three candidates appeared on the Republican presidential primary ballot. The only candidate with a campaign that remained active was Donald Trump. Trump's state director was Neal Tapio.
- Ted Cruz (withdrawn)
- John Kasich (withdrawn)
- Donald Trump
| South Dakota Republican primary, June 7, 2016 | |||||
|---|---|---|---|---|---|
| Candidate | Votes | Percentage | Actual delegate count | ||
| Bound | Unbound | Total | |||
| 44,867 | 67.09% | 29 | 0 | 29 | |
| Ted Cruz (withdrawn) | 11,352 | 16.97% | 0 | 0 | 0 |
| John Kasich (withdrawn) | 10,660 | 15.94% | 0 | 0 | 0 |
| Unprojected delegates: | 0 | 0 | 0 | ||
| Total: | 66,879 | 100.00% | 29 | 0 | 29 |
| Source: The Green Papers | |||||
General Election
Predictions
The following are final 2016 predictions from various organizations for South Dakota as of Election Day.
- Los Angeles Times: Strongly Trump[3]
- CNN: Solid Trump[4]
- Sabato's Crystal Ball: Safe Trump[5]
- NBC: Likely Trump[6]
- RealClearPolitics: Solid Trump[7]
- Fox News: Solid Republican[8]
- ABC: Solid Trump[9]
Statewide Results
| United States presidential election in South Dakota, 2016[10] | ||||||
|---|---|---|---|---|---|---|
| Party | Candidate | Running Mate | Votes | Percentage | Electoral votes | |
| Republican | Donald Trump | Mike Pence | 227,721 | 61.53% | 3 | |
| Democratic | Hillary Clinton | Tim Kaine | 117,458 | 31.74% | 0 | |
| Libertarian | Gary Johnson | William Weld | 20,845 | 5.63% | 0 | |
| Constitution | Darrell Castle | Scott Bradley | 4,059 | 1.10% | 0 | |
| Totals | 370,093 | 100.00% | 3 | |||
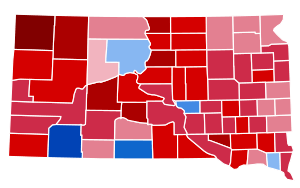
Results by county
Unofficial results by county last updated November 9, 2016.[11]
| County | Candidate | Total | ||||
|---|---|---|---|---|---|---|
| Trump | Clinton | Johnson | Castle | |||
| Aurora | percent | 69.23% | 24.16% | 5.26% | 1.35% | 100.00% |
| votes | 974 | 340 | 74 | 19 | 1,407 | |
| Beadle | percent | 65.79% | 28.23% | 4.77% | 1.21% | 100.00% |
| votes | 4,455 | 1,912 | 323 | 82 | 6,772 | |
| Bennett | percent | 57.96% | 35.86% | 4.96% | 1.22% | 100.00% |
| votes | 666 | 412 | 57 | 14 | 1,149 | |
| Bon Homme | percent | 70.78% | 23.67% | 4.34% | 1.21% | 100.00% |
| votes | 2,105 | 704 | 129 | 36 | 2,974 | |
| Brookings | percent | 53.22% | 38.48% | 6.95% | 1.36% | 100.00% |
| votes | 6,748 | 4,879 | 881 | 172 | 12,680 | |
| Brown | percent | 59.66% | 33.84% | 5.68% | 0.83% | 100.00% |
| votes | 9,613 | 5,452 | 915 | 133 | 16,113 | |
| Brule | percent | 68.40% | 24.96% | 5.46% | 1.18% | 100.00% |
| votes | 1,565 | 571 | 125 | 27 | 2,288 | |
| Buffalo | percent | 34.90% | 60.41% | 3.67% | 1.02% | 100.00% |
| votes | 171 | 296 | 18 | 5 | 490 | |
| Butte | percent | 77.20% | 15.95% | 5.66% | 1.20% | 100.00% |
| votes | 3,355 | 693 | 246 | 52 | 4,346 | |
| Campbell | percent | 84.72% | 12.64% | 2.41% | 0.24% | 100.00% |
| votes | 704 | 105 | 20 | 2 | 831 | |
| Charles Mix | percent | 69.39% | 27.24% | 2.85% | 0.52% | 100.00% |
| votes | 2,382 | 935 | 98 | 18 | 3,433 | |
| Clark | percent | 68.74% | 24.02% | 6.22% | 1.03% | 100.00% |
| votes | 1,139 | 398 | 103 | 17 | 1,657 | |
| Clay | percent | 41.61% | 51.45% | 5.82% | 1.12% | 100.00% |
| votes | 2,109 | 2,608 | 295 | 57 | 5,069 | |
| Codington | percent | 66.54% | 27.20% | 5.14% | 1.12% | 100.00% |
| votes | 7,764 | 3,174 | 600 | 131 | 11,669 | |
| Corson | percent | 50.04% | 45.53% | 2.89% | 1.53% | 100.00% |
| votes | 588 | 535 | 34 | 18 | 1,175 | |
| Custer | percent | 69.76% | 23.75% | 5.41% | 1.08% | 100.00% |
| votes | 3,290 | 1,120 | 255 | 51 | 4,716 | |
| Davison | percent | 64.85% | 29.62% | 4.39% | 1.14% | 100.00% |
| votes | 5,157 | 2,355 | 349 | 91 | 7,952 | |
| Day | percent | 59.23% | 35.46% | 4.22% | 1.09% | 100.00% |
| votes | 1,627 | 974 | 116 | 30 | 2,747 | |
| Deuel | percent | 65.67% | 27.40% | 5.62% | 1.30% | 100.00% |
| votes | 1,366 | 570 | 117 | 27 | 2,080 | |
| Dewey | percent | 42.36% | 51.96% | 4.16% | 1.52% | 100.00% |
| votes | 723 | 887 | 71 | 26 | 1,707 | |
| Douglas | percent | 83.36% | 13.33% | 2.55% | 0.75% | 100.00% |
| votes | 1,338 | 214 | 41 | 12 | 1,605 | |
| Edmunds | percent | 74.71% | 19.81% | 4.48% | 0.99% | 100.00% |
| votes | 1,433 | 380 | 86 | 19 | 1,918 | |
| Fall River | percent | 70.47% | 23.04% | 4.66% | 1.82% | 100.00% |
| votes | 2,511 | 821 | 166 | 65 | 3,563 | |
| Faulk | percent | 76.74% | 18.25% | 4.03% | 0.98% | 100.00% |
| votes | 858 | 204 | 45 | 11 | 1,118 | |
| Grant | percent | 66.84% | 27.23% | 4.91% | 1.01% | 100.00% |
| votes | 2,381 | 970 | 175 | 36 | 3,562 | |
| Gregory | percent | 76.52% | 18.70% | 3.73% | 1.05% | 100.00% |
| votes | 1,600 | 391 | 78 | 22 | 2,091 | |
| Haakon | percent | 89.66% | 7.38% | 2.59% | 0.38% | 100.00% |
| votes | 936 | 77 | 27 | 4 | 1,044 | |
| Hamlin | percent | 74.26% | 20.09% | 4.49% | 1.16% | 100.00% |
| votes | 2,051 | 555 | 124 | 32 | 2,762 | |
| Hand | percent | 76.51% | 18.37% | 4.18% | 0.94% | 100.00% |
| votes | 1,391 | 334 | 76 | 17 | 1,818 | |
| Hanson | percent | 74.63% | 21.14% | 2.94% | 1.30% | 100.00% |
| votes | 1,497 | 424 | 59 | 26 | 2,006 | |
| Harding | percent | 90.25% | 4.94% | 4.03% | 0.78% | 100.00% |
| votes | 694 | 38 | 31 | 6 | 769 | |
| Hughes | percent | 63.31% | 29.96% | 5.87% | 0.86% | 100.00% |
| votes | 5,174 | 2,449 | 480 | 70 | 8,173 | |
| Hutchinson | percent | 74.80% | 20.56% | 3.33% | 1.31% | 100.00% |
| votes | 2,517 | 692 | 112 | 44 | 3,365 | |
| Hyde | percent | 78.70% | 18.12% | 2.46% | 0.72% | 100.00% |
| votes | 543 | 125 | 17 | 5 | 690 | |
| Jackson | percent | 65.94% | 29.50% | 3.29% | 1.28% | 100.00% |
| votes | 722 | 323 | 36 | 14 | 1,095 | |
| Jerauld | percent | 67.01% | 27.30% | 3.72% | 1.96% | 100.00% |
| votes | 648 | 264 | 36 | 19 | 967 | |
| Jones | percent | 80.65% | 12.37% | 5.73% | 1.25% | 100.00% |
| votes | 450 | 69 | 32 | 7 | 558 | |
| Kingsbury | percent | 65.86% | 27.56% | 5.45% | 1.14% | 100.00% |
| votes | 1,680 | 703 | 139 | 29 | 2,551 | |
| Lake | percent | 59.50% | 34.10% | 5.28% | 1.12% | 100.00% |
| votes | 4,038 | 2,314 | 358 | 76 | 6,786 | |
| Lawrence | percent | 62.58% | 28.34% | 7.89% | 1.19% | 100.00% |
| votes | 7,411 | 3,356 | 934 | 141 | 11,842 | |
| Lincoln | percent | 61.43% | 32.01% | 5.60% | 0.96% | 100.00% |
| votes | 15,499 | 8,076 | 1,413 | 243 | 25,231 | |
| Lyman | percent | 68.75% | 25.97% | 3.94% | 1.34% | 100.00% |
| votes | 977 | 369 | 56 | 19 | 1,421 | |
| Marshall | percent | 54.24% | 38.73% | 6.01% | 1.03% | 100.00% |
| votes | 1,056 | 754 | 117 | 20 | 1,947 | |
| McCook | percent | 69.35% | 24.08% | 5.03% | 1.55% | 100.00% |
| votes | 1,794 | 623 | 130 | 40 | 2,587 | |
| McPherson | percent | 78.45% | 16.89% | 3.78% | 0.88% | 100.00% |
| votes | 892 | 192 | 43 | 10 | 1,137 | |
| Meade | percent | 72.64% | 19.13% | 7.16% | 1.08% | 100.00% |
| votes | 8,441 | 2,223 | 832 | 125 | 11,621 | |
| Mellette | percent | 58.86% | 34.85% | 4.69% | 1.61% | 100.00% |
| votes | 402 | 238 | 32 | 11 | 683 | |
| Miner | percent | 66.35% | 26.41% | 6.30% | 0.94% | 100.00% |
| votes | 706 | 281 | 67 | 10 | 1,064 | |
| Minnehaha | percent | 53.72% | 39.11% | 6.07% | 1.10% | 100.00% |
| votes | 42,043 | 30,610 | 4,753 | 857 | 78,263 | |
| Moody | percent | 59.01% | 35.56% | 4.47% | 0.96% | 100.00% |
| votes | 1,729 | 1,042 | 131 | 28 | 2,930 | |
| Oglala Lakota | percent | 8.32% | 86.46% | 3.59% | 1.62% | 100.00% |
| votes | 241 | 2,504 | 104 | 47 | 2,896 | |
| Pennington | percent | 62.43% | 29.48% | 6.99% | 1.10% | 100.00% |
| votes | 29,804 | 14,074 | 3,338 | 525 | 47,741 | |
| Perkins | percent | 83.00% | 11.71% | 4.36% | 0.93% | 100.00% |
| votes | 1,333 | 188 | 70 | 15 | 1,606 | |
| Potter | percent | 80.07% | 16.10% | 3.00% | 0.82% | 100.00% |
| votes | 1,069 | 215 | 40 | 11 | 1,335 | |
| Roberts | percent | 55.12% | 39.60% | 4.22% | 1.06% | 100.00% |
| votes | 2,142 | 1,539 | 164 | 41 | 3,886 | |
| Sanborn | percent | 72.93% | 21.46% | 4.54% | 1.07% | 100.00% |
| votes | 819 | 241 | 51 | 12 | 1,123 | |
| Spink | percent | 62.83% | 31.14% | 4.85% | 1.19% | 100.00% |
| votes | 1,854 | 919 | 143 | 35 | 2,951 | |
| Stanley | percent | 73.26% | 21.00% | 4.91% | 0.83% | 100.00% |
| votes | 1,148 | 329 | 77 | 13 | 1,567 | |
| Sully | percent | 78.86% | 15.91% | 4.65% | 0.58% | 100.00% |
| votes | 679 | 137 | 40 | 5 | 861 | |
| Todd | percent | 22.92% | 70.82% | 4.52% | 1.74% | 100.00% |
| votes | 487 | 1,505 | 96 | 37 | 2,125 | |
| Tripp | percent | 78.67% | 17.57% | 3.19% | 0.57% | 100.00% |
| votes | 2,069 | 462 | 84 | 15 | 2,630 | |
| Turner | percent | 70.77% | 23.16% | 5.20% | 0.87% | 100.00% |
| votes | 2,937 | 961 | 216 | 36 | 4,150 | |
| Union | percent | 66.98% | 28.21% | 3.95% | 0.86% | 100.00% |
| votes | 5,288 | 2,227 | 312 | 68 | 7,895 | |
| Walworth | percent | 76.54% | 18.45% | 3.19% | 1.82% | 100.00% |
| votes | 1,896 | 457 | 79 | 45 | 2,477 | |
| Yankton | percent | 58.80% | 34.33% | 5.73% | 1.14% | 100.00% |
| votes | 5,654 | 3,301 | 551 | 110 | 9,616 | |
| Ziebach | percent | 48.04% | 45.95% | 3.66% | 2.35% | 100.00% |
| votes | 368 | 352 | 28 | 18 | 766 | |
| Total | percent | 61.53% | 31.74% | 5.63% | 1.10% | 100.00% |
| votes | 227,701 | 117,442 | 20,845 | 4,059 | 370,047 | |
Analysis
South Dakota gave Republican nominee Donald Trump a more than 29-point margin of victory over Democratic rival Hillary Clinton, thus gaining him three electoral votes.[12] The Mount Rushmore state's politics are driven by agrarian conservatism, with the eastern portion of the state being largely rural and considered an extension of the Corn Belt. The western portion of the state is even more conservative.[13] South Dakota, like many neighboring majority-white Great Plains and prairie states in the Farm Belt, has not voted for a Democratic candidate since the landslide election of Lyndon B. Johnson in 1964.
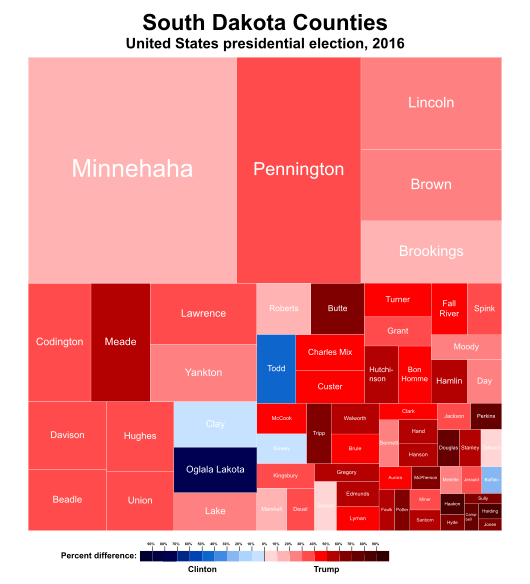
Donald Trump carried most of the state's counties, including Hughes County where the capital city of Pierre is located, Pennington County which contains Rapid City, Minnehaha County which contains Sioux Falls, Brown County which contains Aberdeen, and Codington County which contains Watertown. Clinton won only five counties statewide: Todd, Buffalo, Dewey, and Oglala Lakota, all of which are majority Native American, and Clay County which contains the University of South Dakota.[14]
See also
References
- ↑ https://www.nytimes.com/elections/results/south-dakota
- ↑ "2016 Presidential Election Statistics". Dave Leip’s Atlas of U.S. Presidential Elections. Retrieved 2018-03-05.
- ↑ "Our final map has Clinton winning with 352 electoral votes. Compare your picks with ours". Los Angeles Times. 2016-11-06. Retrieved 2016-11-13.
- ↑ "Road to 270: CNN's general election map - CNNPolitics.com". Cnn.com. 2016-11-08. Retrieved 2016-11-13.
- ↑ "Larry J. Sabato's Crystal Ball » 2016 President". Centerforpolitics.org. 2016-11-07. Retrieved 2016-11-13.
- ↑ Todd, Chuck. "NBC's Final Battleground Map Shows Clinton With a Significant Lead". NBC News. Retrieved 2016-11-13.
- ↑ "2016 Election Maps - Battle for White House". RealClearPolitics. Retrieved 2016-11-13.
- ↑ "Electoral Scorecard: Map shifts again in Trump's favor, as Clinton holds edge". Fox News. 2016-11-07. Retrieved 2016-11-13.
- ↑ "The Final 15: The Latest Polls in the Swing States That Will Decide the Election". Abcnews.go.com. 2016-11-07. Retrieved 2016-11-13.
- ↑ https://uselectionatlas.org/RESULTS/state.php?year=2016&fips=46&f=0&off=0&elect=0
- ↑ Unofficial Results General Election - November 8, 2016 South Dakota Secretary of State. Last Updated: 11/9/2016.
- ↑ "South Dakota Election Results 2016". Retrieved 2016-11-11.
- ↑ Cohen, Micah. "In South Dakota, Only the Farm Trumps Conservatism". FiveThirtyEight. Retrieved 2016-11-11.
- ↑ "2016 election results: South Dakota". www.cnn.com. Retrieved 2016-11-11.