United States presidential election in Arizona, 2016
|
| ||||||||||||||||||||||||||
| ||||||||||||||||||||||||||
| Turnout |
74.17% | |||||||||||||||||||||||||
|---|---|---|---|---|---|---|---|---|---|---|---|---|---|---|---|---|---|---|---|---|---|---|---|---|---|---|
| ||||||||||||||||||||||||||
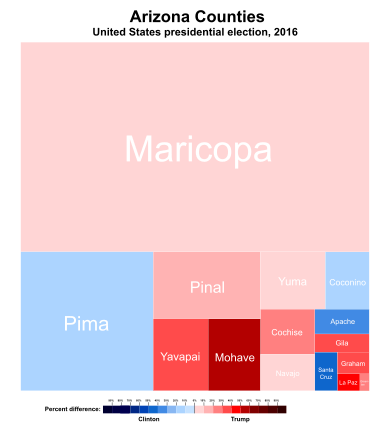
 County Results
| ||||||||||||||||||||||||||
 Results by county showing number of votes by size, and candidates by color | ||||||||||||||||||||||||||
| ||||||||||||||||||||||||||
.jpg)

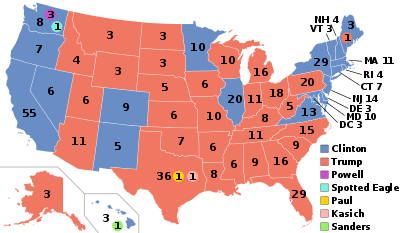
The 2016 United States presidential election in Arizona was won by Donald Trump on November 8, 2016, as part of the 2016 General Election in which all 50 states plus The District of Columbia participated. Arizona voters chose electors to represent them in the Electoral College via a popular vote pitting the Republican Party's nominee, businessman Donald Trump, and running mate Indiana Governor Mike Pence against Democratic Party nominee, former Secretary of State Hillary Clinton and her running mate, Virginia Senator Tim Kaine.
On March 22, 2016, in the presidential primaries, Arizona voters expressed their preferences for the Democratic, Republican, and Green parties' respective nominees for president. (The Libertarian Party uses a privately funded caucus to select its presidential delegates and does not allow independents to vote in its primary.[1]) Registered members of each party only voted in their party's primary, while voters who were unaffiliated chose any one primary in which to vote, except in presidential elections.
Primary elections
Democratic primary


Six candidates appeared on the Democratic presidential primary ballot:[2]
- Bernie Sanders
- Hillary Clinton
- Rocky De La Fuente
- Martin O'Malley (withdrawn)
- Henry Hewes
- Michael Steinberg
Opinion polling
Results
| Candidate | Popular vote | Estimated delegates | |||
|---|---|---|---|---|---|
| Count | Percentage | Pledged | Unpledged | Total | |
| Hillary Clinton | 262,459 | 56.29% | 42 | 6 | 48 |
| Bernie Sanders | 192,962 | 41.39% | 33 | 1 | 34 |
| Martin O'Malley (withdrawn) | 3,877 | 0.83% | |||
| Roque "Rocky" De La Fuente | 2,797 | 0.60% | |||
| Michael Steinberg | 2,295 | 0.49% | |||
| Henry Hewes | 1,845 | 0.40% | |||
| Uncommitted | N/A | 3 | 3 | ||
| Total | 466,235 | 100% | 75 | 10 | 85 |
| Source: The Green Papers, Arizona Secretary of State | |||||
- Detailed results per congressional district
| District | Total | Hillary Clinton | Bernie Sanders | |||||
|---|---|---|---|---|---|---|---|---|
| Votes | Delegates | Votes | % | Delegates | Votes | % | Delegates | |
| 1st district | 63,863 | 6 | 35,445 | 55.50% | 3 | 26,267 | 41.13% | 3 |
| 2nd district | 78,237 | 8 | 42,797 | 54.70% | 4 | 33,891 | 43.32% | 4 |
| 3rd district | 51,520 | 5 | 30,298 | 58.81% | 3 | 20,091 | 39.00% | 2 |
| 4th district | 37,273 | 4 | 15,289 | 55.43% | 2 | 20,662 | 41.02% | 2 |
| 5th district | 40,847 | 5 | 22,973 | 56.24% | 3 | 16,982 | 41.57% | 2 |
| 6th district | 50,465 | 6 | 29,266 | 57.99% | 4 | 20,259 | 40.14% | 2 |
| 7th district | 42,199 | 5 | 24,245 | 57.45% | 3 | 17,173 | 40.70% | 2 |
| 8th district | 46,491 | 5 | 27,672 | 59.52% | 3 | 17,651 | 37.97% | 2 |
| 9th district | 55,340 | 6 | 29,101 | 52.59% | 3 | 25,359 | 45.82% | 3 |
| At-large delegates | 466,235 | 16 | 262,459 | 56.29% | 9 | 192,962 | 41.39% | 7 |
| Pledged PLEOs | 466,235 | 9 | 262,459 | 56.29% | 5 | 192,962 | 41.39% | 4 |
| Total | 466,235 | 75 | 262,464 | 56.29% | 42 | 192,965 | 41.39% | 33 |
Republican primary


Fourteen candidates appeared on the Republican presidential primary ballot:[5]
- Jeb Bush (withdrawn)
- Ben Carson (withdrawn)
- Chris Christie (withdrawn)
- Ted Cruz
- Carly Fiorina (withdrawn)
- Lindsey Graham (withdrawn)
- Mike Huckabee (withdrawn)
- John Kasich
- George Pataki (withdrawn)
- Rand Paul (withdrawn)
- Marco Rubio (withdrawn)
- Rick Santorum (withdrawn)
- Tim Cook
- Donald Trump
| Arizona Republican primary, March 22, 2016 | |||||
|---|---|---|---|---|---|
| Candidate | Votes | Percentage | Actual delegate count | ||
| Bound | Unbound | Total | |||
| 286,743 | 45.95% | 58 | 0 | 58 | |
| Ted Cruz | 172,294 | 27.61% | 0 | 0 | 0 |
| Marco Rubio (withdrawn) | 72,304 | 11.59% | 0 | 0 | 0 |
| John Kasich | 65,965 | 10.57% | 0 | 0 | 0 |
| Ben Carson (withdrawn) | 14,940 | 2.39% | 0 | 0 | 0 |
| Jeb Bush (withdrawn) | 4,393 | 0.70% | 0 | 0 | 0 |
| Rand Paul (withdrawn) | 2,269 | 0.36% | 0 | 0 | 0 |
| Mike Huckabee (withdrawn) | 1,300 | 0.21% | 0 | 0 | 0 |
| Carly Fiorina (withdrawn) | 1,270 | 0.20% | 0 | 0 | 0 |
| Chris Christie (withdrawn) | 988 | 0.16% | 0 | 0 | 0 |
| Rick Santorum (withdrawn) | 523 | 0.08% | 0 | 0 | 0 |
| Lindsey Graham (withdrawn) | 498 | 0.08% | 0 | 0 | 0 |
| George Pataki (withdrawn) | 309 | 0.05% | 0 | 0 | 0 |
| Timothy Cook (withdrawn) | 243 | 0.04% | 0 | 0 | 0 |
| Unprojected delegates: | 0 | 0 | 0 | ||
| Total: | 624,039 | 100.00% | 58 | 0 | 58 |
| Source: The Green Papers | |||||
Green primary
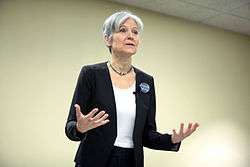
The Arizona Green Party held its primary on March 22. Jill Stein won with 82% of the vote, and the overall number of voters that took place in the primary saw an increase from 561 in 2012 to 770 in 2016.[6] Only two candidates qualified for the primary:[7]
| Arizona Green Party presidential primary, March 22, 2016[8] | |||
|---|---|---|---|
| Candidate | Votes | Percentage | National delegates |
| 666 | 82% | 5 | |
| Kent Mesplay | 151 | 18% | 1 |
| Write-in/Blank | 18 | 2% | - |
| Total | 817 | 100.00% | 6 |
Alleged voter suppression
There is considerable controversy surrounding the Arizona primary elections of 2016, specifically having to do with the dramatic decrease in polling places in Maricopa County from 200 in 2012, to only 60 in 2016, despite the number of registered voters having increased from 300,000 in 2012 to 800,000 in 2016. This decrease in polling places was most pronounced in minority neighborhoods, most notably Latino neighborhoods, with areas like Central Phoenix having only 1 polling place for 108,000 voters. There were also reports of many voters who had been previously registered, coming up as unregistered, or registered as an independent, making them ineligible to vote. Voters who did manage to vote had to stand in long lines to cast their ballots, some for as long as five hours. Additionally, voters reported being required to vote with a provisional ballot. In 2005, Arizona threw out 27,878 provisional ballots, counting only about 72.5% of the total provisional ballots reported.[9] Taking into account Arizona's increasingly lax voting laws, and the amplifying effects of the Supreme Court's "gutting of the Voting Rights Act",[10] it's unknown what percentage of the provisional ballots were counted. This was the first presidential primary election in the state of Arizona since the 2013 Supreme Court decision to strike down Section 5 of the Voting Rights Act of 1965, which would have previously required Southern states with a history of voter discrimination, including Arizona, to receive federal approval before implementing any changes to voting laws and practices. These irregularities have led many to suspect a deliberate act of voter suppression and electoral fraud.
Within a day after the election took place on March 22, a petition went viral on the White House petitions site asking the Department of Justice to investigate voter suppression and election fraud in Arizona that reached its goal of 100,000 signatures in record time compared to other popular petitions.[11] In addition, Phoenix mayor Greg Stanton asked the Justice Department to launch an investigation into the allegations of voter suppression.
The Department of Justice has since launched a federal investigation into the primary.[12]
Polling
General election
Predictions
The following are final 2016 predictions from various organizations for Arizona as of Election Day.
- Los Angeles Times: Likely Clinton[13]
- CNN: Battleground[14]
- Sabato's Crystal Ball: Leans Trump[15]
- NBC: Tossup[16]
- RealClearPolitics: Toss-up[17]
- Fox News: Leans Republican[18]
- ABC: Tossup[19]
Statewide results
| Party | Candidate | Votes | % | |
|---|---|---|---|---|
| Republican | Donald Trump | 1,252,401 | 49.03% | |
| Democratic | Hillary Clinton | 1,161,167 | 45.46% | |
| Libertarian | Gary Johnson | 106,327 | 4.16% | |
| Green | Jill Stein | 34,345 | 1.34% | |
| Total votes | 2,554,240 | 100.00% | ||
Results by county
| County | Trump# | Trump% | Clinton# | Clinton% | Johnson# | Johnson% | Stein# | Stein% | Total Votes |
|---|---|---|---|---|---|---|---|---|---|
| Apache | 8,240 | 30.50% | 17,083 | 63.24% | 1,221 | 4.52% | 469 | 1.74% | 27,013 |
| Cochise | 28,092 | 57.41% | 17,450 | 35.66% | 2,394 | 4.89% | 993 | 2.03% | 48,929 |
| Coconino | 21,108 | 36.45% | 32,404 | 56.44% | 2,978 | 5.14% | 1,414 | 2.44% | 57,904 |
| Gila | 14,182 | 63.88% | 7,003 | 31.55% | 803 | 3.62% | 212 | 0.95% | 22,200 |
| Graham | 8,025 | 67.22% | 3,301 | 27.65% | 497 | 4.16% | 116 | 0.97% | 11,939 |
| Greenlee | 1,892 | 58.34% | 1,092 | 33.67% | 200 | 6.17% | 59 | 1.82% | 3,243 |
| La Paz | 4,003 | 68.29% | 1,575 | 26.87% | 211 | 3.60% | 73 | 1.25% | 5,862 |
| Maricopa | 747,361 | 48.63% | 702,907 | 45.74% | 67,043 | 4.36% | 19,432 | 1.26% | 1,536,743 |
| Mohave | 58,282 | 73.67% | 17,455 | 22.06% | 2,639 | 3.34% | 740 | 0.94% | 79,116 |
| Navajo | 20,577 | 52.56% | 16,459 | 42.04% | 1,410 | 3.60% | 703 | 1.80% | 39,149 |
| Pima | 167,428 | 40.45% | 224,661 | 54.28% | 15,620 | 3.77% | 6,200 | 1.50% | 413,909 |
| Pinal | 72,819 | 57.25% | 47,892 | 37.65% | 5,010 | 3.94% | 1,467 | 1.15% | 127,197 |
| Santa Cruz | 3,897 | 24.45% | 11,690 | 71.58% | 432 | 2.66% | 221 | 1.36% | 16,240 |
| Yavapai | 71,330 | 63.40% | 35,590 | 31.63% | 3,996 | 3.55% | 1,588 | 1.41% | 112,504 |
| Yuma | 25,165 | 48.12% | 24,605 | 47.05% | 1,873 | 3.58% | 649 | 1.24% | 52,292 |
By congressional district
Trump won 5 of 9 congressional districts, including one represented by a Democrat. Clinton also carried a district represented by a Republican.[21]
| District | Trump | Clinton | Representative |
|---|---|---|---|
| 1st | 48% | 47% | Ann Kirkpatrick |
| Tom O'Halleran | |||
| 2nd | 44% | 49% | Martha McSally |
| 3rd | 32% | 62% | Raúl Grijalva |
| 4th | 66% | 27% | Paul Gosar |
| 5th | 56% | 36% | Matt Salmon |
| Andy Biggs | |||
| 6th | 52% | 42% | David Schweikert |
| 7th | 22% | 71% | Ruben Gallego |
| 8th | 57% | 36% | Trent Franks |
| 9th | 38% | 54% | Kyrsten Sinema |
Turnout
Voter Turnout was 74.17% with 2,661,497 ballots cast out of 3,588,466 voters.[20]
Analysis
Donald Trump won Arizona with a margin of 3.57%, a significantly reduced margin from Mitt Romney's 9.03% margin in 2012.[22] Arizona was among the eleven states in which Hillary Clinton outperformed Barack Obama's margin in 2012,[23] primarily due to an increase in Hispanic voter turnout in southern Arizona, including heavily populated Maricopa County. Maricopa County in particular, went from a 10.69% margin of victory for Romney in 2012 to a 2.84% margin of victory for Trump.
Clinton also came close to winning Yuma County, and would have been the first Democrat to do so since the county was separated from La Paz County in the 1980s. Other rural counties that had been won by Bill Clinton in the 1990s continued to trend in a Republican direction.
In terms of percentage of the vote, Trump's strongest support was in the northwest of the state whereas Clinton did best in the southern-central region.
Electors
Arizona had 11 electors in 2016. All of them voted for Donald Trump for president and Mike Pence for vice president.
The electors were
- Bruce Ash
- Walter Begay
- Sharon Giese
- Robert Graham
- Alberto Gutier
- Jerry Hayden
- Carole Joyce
- Jane Pierpoint Lynch
- J. Foster Morgan
- James O'Connor
- Edward Robson
See also
References
- ↑ "How to vote in Arizona's presidential-preference election". Azcentral.com. March 22, 2016. Retrieved November 13, 2016.
- ↑ "Democratic Party Candidates - Presidential Preference Election 2016". azsos.gov. Secretary of State of Arizona. Retrieved September 15, 2016.
- ↑ The Green Papers
- ↑ "2016 Arizona District-Level Delegate Math" (PDF). Arizona Democratic Party. April 5, 2016. Retrieved April 8, 2016.
- ↑ "Republican Party Candidates - Presidential Preference Election 2016 | Arizona Secretary of State". Azsos.gov. March 7, 2015. Retrieved December 1, 2016.
- ↑ "Arizona Green Party Presidential Primary Results". Ballot Access News. March 23, 2016. Retrieved March 23, 2016.
- ↑ "Two Candidates Qualify for Arizona Green Party Presidential Primary; Six Qualify for Democratic Primary". Ballot Access News. December 14, 2015. Retrieved February 20, 2016.
- ↑ "Unofficial 2016 Presidential Preference Election Results". azsos.gov. Retrieved March 23, 2016.
- ↑ Beal, Tom (January 29, 2005). "Counties inconsistent in provisional-vote rules. Was your vote counted?". votersunite.org. Arizona Daily Star. Retrieved March 26, 2016.
- ↑ "Voting Rights Act Section 4 Struck Down By Supreme Court".
- ↑ "Petition to White House about Arizona 'voter suppression' hit goal in about 40 hours".
- ↑ Lachman, Samantha; Reilly, Ryan J. (April 4, 2016). "The DOJ Is Investigating Arizona's Election Mess". The Huffington Post. Retrieved April 4, 2016.
- ↑ "Our final map has Clinton winning with 352 electoral votes. Compare your picks with ours". Los Angeles Times. 2016-11-06. Retrieved 2016-11-13.
- ↑ "Road to 270: CNN's general election map - CNNPolitics.com". Cnn.com. 2016-11-08. Retrieved 2016-11-13.
- ↑ "Larry J. Sabato's Crystal Ball » 2016 President". Centerforpolitics.org. 2016-11-07. Retrieved 2016-11-13.
- ↑ Todd, Chuck. "NBC's Final Battleground Map Shows Clinton With a Significant Lead". NBC News. Retrieved 2016-11-13.
- ↑ "2016 Election Maps - Battle for White House". RealClearPolitics. Retrieved 2016-11-13.
- ↑ "Electoral Scorecard: Map shifts again in Trump's favor, as Clinton holds edge". Fox News. 2016-11-07. Retrieved 2016-11-13.
- ↑ "The Final 15: The Latest Polls in the Swing States That Will Decide the Election". Abcnews.go.com. 2016-11-07. Retrieved 2016-11-13.
- 1 2 "Arizona Secretary of State Election Night Reporting". Results.arizona.vote. Retrieved November 20, 2016.
- ↑ https://www.cookpolitical.com/introducing-2017-cook-political-report-partisan-voter-index
- ↑ "Arizona Election Results 2016 – The New York Times". Retrieved November 10, 2016.
- ↑ http://uselectionatlas.org/RESULTS/data.php?year=2016&def=swg&datatype=national&f=0&off=0&elect=0
External links
- RNC 2016 Republican Nominating Process
- Green papers for 2016 primaries, caucuses, and conventions
- 2016 Presidential primaries, ElectionProjection.com