Calhoun County, Illinois
| Calhoun County, Illinois | |
|---|---|
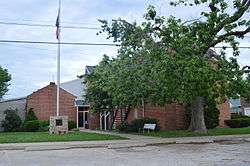 Calhoun County Courthouse in Hardin | |
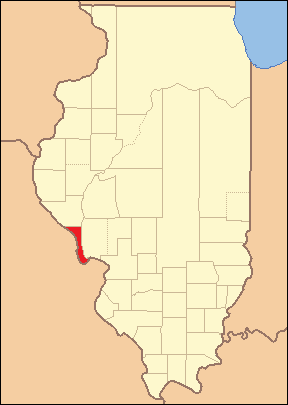
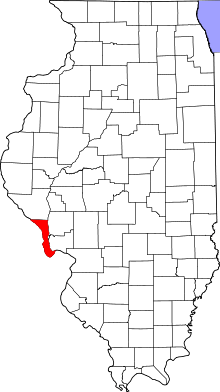 Location in the U.S. state of Illinois | |
 Illinois's location in the U.S. | |
| Founded | 1825 |
| Named for | John C. Calhoun |
| Seat | Hardin |
| Largest village | Hardin |
| Area | |
| • Total | 284 sq mi (736 km2) |
| • Land | 254 sq mi (658 km2) |
| • Water | 30 sq mi (78 km2), 10.5% |
| Population | |
| • (2010) | 5,089 |
| • Density | 20/sq mi (8/km2) |
| Congressional district | 13th |
| Time zone | Central: UTC−6/−5 |
Calhoun County is a county in the U.S. state of Illinois. As of the 2010 census, the population was 5,089,[1] making it Illinois’ third-least populous county. Its county seat and biggest community is Hardin, with a population of slightly less than 1,000.[2] Its smallest community is Hamburg, with a population of 123. Calhoun County is at the tip of the peninsula formed by the courses of the Mississippi and Illinois rivers above their confluence and is almost completely surrounded by water. Calhoun County is sparsely populated; it has just five municipalities, all of them villages.[3]
Calhoun County is part of the Metro-East portion of the St. Louis, MO-IL Metropolitan Statistical Area.
History
The territory was originally settled by indigenous people who occupied the resource-rich river valleys near waterways. The remains of their occupation have provided some of the most valuable archaeological information in the country. The county's archaeological record chronicles more than 10,000 years of continuous human occupation by Native Americans.
Calhoun County was settled by Americans during the 19th century, and officially organized in 1825. It was named for Vice President John C. Calhoun, in addition to the Calhoun family that was prominent in the area at the time. The southern side of the county, covered in thick forest, was untouched until the population began to expand in the late 1840s with the arrival of German immigrants. Land was cleared for farming, exporting lumber, and constructing spacious log barns, typically 200 square feet (19 m2) in size, which were a "trademark of successful German farmers."[4]
The most well-known historical event to impact Calhoun County is likely the Great Flood of 1993. Calhoun County is a peninsula nestled between the Illinois and Mississippi Rivers, which both saw record flooding during 1993. The Great Flood of 1993, the name it is now known as, impacted several villages in Calhoun and completely destroyed the village of East Hardin which once sat across the Joe Page Bridge when a levee broke in August of 1993. The flood also closed all crossings over the rivers in the county including the bridge in Hardin and all ferries, leaving residents without access to groceries, gasoline, or other supplies. All supplies needed had to be flown in via helicopter or retrieved on a 2 hour long drive north via the only road existing Calhoun without a water passage or was not covered by flood water. The Great Flood of 1993 was devastating to Calhoun County because it destroyed homes, infrastructure, and caused many residents to leave. The population of the county has yet to recover.
Geography
According to the U.S. Census Bureau, the county has a total area of 284 square miles (740 km2), of which 254 square miles (660 km2) is land and 30 square miles (78 km2) (10.5%) is water.[5]
Calhoun County is a narrow 37-mile (60 km)-long peninsula of mostly high, rolling ground located between the Mississippi River and the Illinois River. The rolling hills escaped the leveling of glaciers.
County transportation is served by two state-operated, free ferries crossing the Illinois River (the Brussels Ferry in the south and the Kampsville ferry in the north). The Golden Eagle ferry, which is privately operated and charges a toll, crosses the Mississippi River to St. Charles County, Missouri. A bridge spans the Illinois River at Hardin. Land routes connect to the north to bordering Pike County.
When transportation was mainly by river, the county had many prosperous farms and orchards. It still produces a major portion of the peach crop of Illinois, and farmers raise corn and other commodities. The hotel in Brussels dates from 1847, when it was a stagecoach stop.
Tourists visit the area for the natural environment of the Illinois River valley and for its proximity to the Great River Road on the Illinois side. It includes part of the Two Rivers National Wildlife Refuge and attracts thousands of birds in migration seasons as part of the Mississippi Flyway. The county has several designated historic districts in the villages and properties listed on the National Register of Historic Places.
Calhoun County was added to the St. Louis Metropolitan Statistical Area in 2003, along with Bond and Macoupin counties in Illinois, and Washington County, Missouri.
The Center for American Archeology is located in Kampsville in the northern part of the county. It has been the center for study of prehistoric indigenous culture in the area. It has created educational opportunities for children and adults to participate in its archaeological digs.
Adjacent counties
- Greene County – northeast
- Jersey County – east
- St. Charles County, Missouri – south
- Lincoln County, Missouri – west
- Pike County, Illinois – north
- Pike County, Missouri – northwest
National protected area
Major highways
Climate and weather
| Hardin, Illinois | ||||||||||||||||||||||||||||||||||||||||||||||||||||||||||||
|---|---|---|---|---|---|---|---|---|---|---|---|---|---|---|---|---|---|---|---|---|---|---|---|---|---|---|---|---|---|---|---|---|---|---|---|---|---|---|---|---|---|---|---|---|---|---|---|---|---|---|---|---|---|---|---|---|---|---|---|---|
| Climate chart (explanation) | ||||||||||||||||||||||||||||||||||||||||||||||||||||||||||||
| ||||||||||||||||||||||||||||||||||||||||||||||||||||||||||||
| ||||||||||||||||||||||||||||||||||||||||||||||||||||||||||||
In recent years, average temperatures in the county seat of Hardin have ranged from a low of 19 °F (−7 °C) in January to a high of 90 °F (32 °C) in July, although a record low of −24 °F (−31 °C) was recorded in January 1979 and a record high of 116 °F (47 °C) was recorded in July 1954. Average monthly precipitation ranged from 2.01 inches (51 mm) in January to 4.10 inches (104 mm) in May.[6]
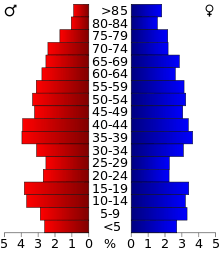
Demographics
| Historical population | |||
|---|---|---|---|
| Census | Pop. | %± | |
| 1830 | 1,090 | — | |
| 1840 | 1,740 | 59.6% | |
| 1850 | 3,231 | 85.7% | |
| 1860 | 5,144 | 59.2% | |
| 1870 | 6,562 | 27.6% | |
| 1880 | 7,467 | 13.8% | |
| 1890 | 7,652 | 2.5% | |
| 1900 | 8,917 | 16.5% | |
| 1910 | 8,610 | −3.4% | |
| 1920 | 8,245 | −4.2% | |
| 1930 | 8,034 | −2.6% | |
| 1940 | 8,207 | 2.2% | |
| 1950 | 6,898 | −15.9% | |
| 1960 | 5,933 | −14.0% | |
| 1970 | 5,675 | −4.3% | |
| 1980 | 5,867 | 3.4% | |
| 1990 | 5,322 | −9.3% | |
| 2000 | 5,084 | −4.5% | |
| 2010 | 5,089 | 0.1% | |
| Est. 2017 | 4,833 | [7] | −5.0% |
| U.S. Decennial Census[8] 1790-1960[9] 1900-1990[10] 1990-2000[11] 2010-2013[1] | |||
As of the 2010 United States Census, there were 5,089 people, 2,085 households, and 1,447 families residing in the county.[12] The population density was 20.0 inhabitants per square mile (7.7/km2). There were 2,835 housing units at an average density of 11.2 per square mile (4.3/km2).[5] The racial makeup of the county was 98.9% white, 0.2% Asian, 0.2% American Indian, 0.1% black or African American, 0.2% from other races, and 0.4% from two or more races. Those of Hispanic or Latino origin made up 0.8% of the population.[12] In terms of ancestry, 46.2% were German, 14.7% were American, 12.4% were Irish, and 9.5% were English.[13]
Of the 2,085 households, 28.1% had children under the age of 18 living with them, 59.2% were married couples living together, 7.0% had a female householder with no husband present, 30.6% were non-families, and 27.3% of all households were made up of individuals. The average household size was 2.40 and the average family size was 2.90. The median age was 44.6 years.[12]
The median income for a household in the county was $44,891 and the median income for a family was $57,627. Males had a median income of $42,917 versus $34,514 for females. The per capita income for the county was $23,109. About 7.2% of families and 11.7% of the population were below the poverty line, including 12.3% of those under age 18 and 13.2% of those age 65 or over.[14]
Communities
Villages
Unincorporated communities
Politics
| Year | Republican | Democratic | Third Parties |
|---|---|---|---|
| 2016 | 66.9% 1,721 | 28.7% 739 | 4.3% 111 |
| 2012 | 55.9% 1,440 | 41.9% 1,080 | 2.2% 56 |
| 2008 | 45.1% 1,221 | 52.6% 1,423 | 2.3% 62 |
| 2004 | 48.7% 1,317 | 50.5% 1,367 | 0.8% 22 |
| 2000 | 47.2% 1,229 | 50.4% 1,310 | 2.4% 63 |
| 1996 | 31.2% 941 | 55.6% 1,676 | 13.2% 396 |
| 1992 | 26.6% 745 | 54.2% 1,519 | 19.2% 539 |
| 1988 | 44.4% 1,238 | 55.3% 1,544 | 0.3% 8 |
| 1984 | 53.0% 1,648 | 46.4% 1,443 | 0.5% 16 |
| 1980 | 55.0% 1,591 | 41.7% 1,208 | 3.3% 96 |
| 1976 | 46.4% 1,364 | 52.6% 1,549 | 1.0% 30 |
| 1972 | 56.5% 1,705 | 43.1% 1,299 | 0.4% 13 |
| 1968 | 49.1% 1,542 | 42.3% 1,329 | 8.5% 268 |
| 1964 | 41.6% 1,288 | 58.4% 1,805 | |
| 1960 | 50.6% 1,654 | 49.2% 1,608 | 0.2% 5 |
| 1956 | 55.8% 1,892 | 44.2% 1,498 | 0.0% 1 |
| 1952 | 56.8% 1,915 | 43.1% 1,454 | 0.1% 2 |
| 1948 | 52.2% 1,526 | 47.1% 1,377 | 0.7% 20 |
| 1944 | 60.4% 1,956 | 39.2% 1,271 | 0.4% 14 |
| 1940 | 60.5% 2,516 | 39.1% 1,625 | 0.4% 17 |
| 1936 | 45.9% 1,883 | 50.2% 2,058 | 3.9% 161 |
| 1932 | 35.4% 1,239 | 63.6% 2,229 | 1.0% 36 |
| 1928 | 50.2% 1,594 | 48.8% 1,551 | 1.0% 33 |
| 1924 | 48.1% 1,136 | 47.2% 1,115 | 4.7% 110 |
| 1920 | 64.8% 1,367 | 33.3% 703 | 1.9% 39 |
| 1916 | 48.4% 1,168 | 48.9% 1,181 | 2.7% 64 |
| 1912 | 30.6% 373 | 49.4% 602 | 20.0% 243 |
| 1908 | 42.6% 735 | 52.4% 905 | 5.0% 86 |
| 1904 | 42.8% 730 | 47.7% 815 | 9.5% 162 |
| 1900 | 42.0% 873 | 56.5% 1,175 | 1.5% 31 |
| 1896 | 40.0% 795 | 59.2% 1,176 | 0.8% 15 |
| 1892 | 35.7% 563 | 53.2% 840 | 11.1% 175 |
For two generations following the Civil War, Calhoun County was typical of the German counties on the Illinois side of the Mississippi River in being heavily Democratic as it had opposed the “Yankee” American Civil War. Only when German-Americans were offended at Woodrow Wilson’s policies towards Germany did the county vote Republican for the first time in 1920, and it narrowly repeated that in the GOP landslides of 1924 and 1928. The county did turn strongly Republican due again to opposition to war involvement in 1940, and remained Republican-leaning for three decades. Between 1970 and 2008 Calhoun turned Democratic once more – George Bush senior in 1992 won a smaller proportion of the vote than Alf Landon in 1936 or William Howard Taft in 1912. However, opposition to the Democratic Party’s liberal social policies has turned the county powerfully Republican during the 2010s, so that Hillary Clinton’s 2016 vote percentage is the worst ever by a Democrat.
Education
- Brussels Community Unit School District 42
- Calhoun Community Unit School District 40
See also
References
- Specific
- 1 2 "State & County QuickFacts". United States Census Bureau. Retrieved July 4, 2014.
- ↑ "Find a County". National Association of Counties. Archived from the original on 2011-05-31. Retrieved 2011-06-07.
- ↑ "Visitors Guide to Calhoun County". greatriverroad.com. Retrieved 2012-08-11.
- ↑ Price, H. Wayne (Summer 1980). "The Double-Crib Log Barns of Calhoun County". Journal of the Illinois State Historical Society. 73 (2): 140–160.
- 1 2 "Population, Housing Units, Area, and Density: 2010 - County". United States Census Bureau. Retrieved 2015-07-12.
- 1 2 "Monthly Averages for Hardin, Illinois". The Weather Channel. Retrieved 2011-01-27.
- ↑ "Population and Housing Unit Estimates". Retrieved June 9, 2017.
- ↑ "U.S. Decennial Census". United States Census Bureau. Archived from the original on May 12, 2015. Retrieved July 4, 2014.
- ↑ "Historical Census Browser". University of Virginia Library. Retrieved July 4, 2014.
- ↑ "Population of Counties by Decennial Census: 1900 to 1990". United States Census Bureau. Retrieved July 4, 2014.
- ↑ "Census 2000 PHC-T-4. Ranking Tables for Counties: 1990 and 2000" (PDF). United States Census Bureau. Retrieved July 4, 2014.
- 1 2 3 "DP-1 Profile of General Population and Housing Characteristics: 2010 Demographic Profile Data". United States Census Bureau. Retrieved 2015-07-12.
- ↑ "DP02 SELECTED SOCIAL CHARACTERISTICS IN THE UNITED STATES – 2006-2010 American Community Survey 5-Year Estimates". United States Census Bureau. Retrieved 2015-07-12.
- ↑ "DP03 SELECTED ECONOMIC CHARACTERISTICS – 2006-2010 American Community Survey 5-Year Estimates". United States Census Bureau. Retrieved 2015-07-12.
- ↑ http://uselectionatlas.org/RESULTS
- General
External links
- Illinois Genealogy Trails: Calhoun County, Illinois
- History of Calhoun County, Illinois
- Calhoun County Unit 40
Places adjacent to Calhoun County, Illinois | ||||||||||
|---|---|---|---|---|---|---|---|---|---|---|
| ||||||||||
Municipalities and communities of Calhoun County, Illinois, United States | ||
|---|---|---|
| Villages | ||
| Precincts | ||
| Unincorporated communities | ||
| Counties | 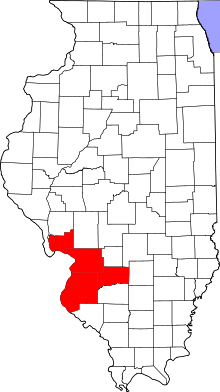 | |
|---|---|---|
| Major Cities (25,000+) | ||
| Cities (5,000-25,000) | ||
| Communities (1,000-5,000) |
| |
| Interstates | ||
| Airports | ||
| Colleges | ||
| Sports teams |
| |
| Topics | 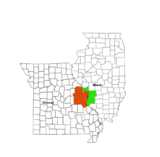 | |
|---|---|---|
| Central city | ||
| Largest cities (over 50,000 in 2010) | ||
| Medium-sized cities (over 20,000 in 2010) | ||
| Largest towns and villages (over 10,000 in 2010) |
| |
| Missouri Counties | ||
| Illinois Counties | ||
| Subregions | ||

| Counties |  | |
|---|---|---|
| Mid-sized cities (25,000+) | ||
| Small Cities (10,000-25,000) | ||
| Small Cities (5,000-10,000) | ||
| Interstates | ||
| Airports/Military bases |
| |
| Universities | ||
| Colleges | ||
| Sports teams based in the Southern Illinois | ||