Perry County, Illinois
| Perry County, Illinois | |
|---|---|
 Perry County Courthouse in Pinckneyville | |
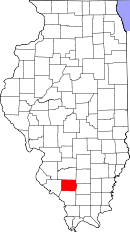 Location in the U.S. state of Illinois | |
 Illinois's location in the U.S. | |
| Founded | 1827 |
| Named for | Oliver Hazard Perry |
| Seat | Pinckneyville |
| Largest city | Du Quoin |
| Area | |
| • Total | 447 sq mi (1,158 km2) |
| • Land | 442 sq mi (1,145 km2) |
| • Water | 5.2 sq mi (13 km2), 1.2% |
| Population | |
| • (2010) | 22,350 |
| • Density | 51/sq mi (20/km2) |
| Congressional district | 12th |
| Time zone | Central: UTC−6/−5 |
| Website |
www |
Perry County is a county located in the U.S. state of Illinois. According to the 2010 census, it had a population of 22,350.[1] Its county seat is Pinckneyville.[2] It is located in the southern portion of Illinois known locally as "Little Egypt".
History
Perry County was formed in 1827 out of Jackson and Randolph counties. It was named in honor of Oliver Hazard Perry who defeated the British fleet at the decisive Battle of Lake Erie in the War of 1812.
 Perry County at the time of its creation in 1827
In its early history, Perry County was mainly an inland pioneer outpost. Early settlers, including some Revolutionary War veterans bearing land grants, moved here from the Eastern United States. These were primarily Protestant settlers. Growth boomed in the 1850s for two reasons: construction of the Illinois Central Railroad through the eastern portion of the county, and the discovery of large coal reserves. Immigrants from Ireland, Poland, Germany, Italy and elsewhere steadily increased the County's population from 1850 through the 1920s. African Americans also were established in the County during northward migration following the Civil War.
Mining continued to be the dominant employment sector through the 1990s.
Geography
According to the U.S. Census Bureau, the county has a total area of 447 square miles (1,160 km2), of which 442 square miles (1,140 km2) is land and 5.2 square miles (13 km2) (1.2%) is water.[3]
Perry County is located in Southern Illinois. Pinckneyville, at the center of the county, is approximately 70 miles (110 km) southeast of St. Louis, Missouri and 300 miles (480 km) southwest of Chicago. The Mississippi River lies about 10 miles (16 km) west and southwest of the County at its closest point.
The County's topography is mainly flat with some rolling hills. The part of the County's eastern border, the part shared with Franklin County, is formed by the Little Muddy River. Beaucoup Creek runs north to south through the County and lies just east of Pinckneyville.
The county's topography also features many "strip cut" lakes, lakes left behind following above-ground coal mining. Lakes at two of the county's chief recreation areas, the Du Quoin State Fairgrounds and Pyramid State Recreation Area, were formed this way.
Climate and weather
| Pinckneyville, Illinois | ||||||||||||||||||||||||||||||||||||||||||||||||||||||||||||
|---|---|---|---|---|---|---|---|---|---|---|---|---|---|---|---|---|---|---|---|---|---|---|---|---|---|---|---|---|---|---|---|---|---|---|---|---|---|---|---|---|---|---|---|---|---|---|---|---|---|---|---|---|---|---|---|---|---|---|---|---|
| Climate chart (explanation) | ||||||||||||||||||||||||||||||||||||||||||||||||||||||||||||
| ||||||||||||||||||||||||||||||||||||||||||||||||||||||||||||
| ||||||||||||||||||||||||||||||||||||||||||||||||||||||||||||
In recent years, average temperatures in the county seat of Pinckneyville have ranged from a low of 22 °F (−6 °C) in January to a high of 90 °F (32 °C) in July, although a record low of −22 °F (−30 °C) was recorded in January 1912 and a record high of 113 °F (45 °C) was recorded in July 1934. Average monthly precipitation ranged from 2.61 inches (66 mm) in February to 4.81 inches (122 mm) in May.[4]
Major highways
Adjacent counties
- Washington County - north
- Jefferson County - northeast
- Franklin County - east
- Jackson County - south
- Randolph County - west
Demographics
| Historical population | |||
|---|---|---|---|
| Census | Pop. | %± | |
| 1830 | 1,215 | — | |
| 1840 | 3,222 | 165.2% | |
| 1850 | 5,278 | 63.8% | |
| 1860 | 9,552 | 81.0% | |
| 1870 | 13,723 | 43.7% | |
| 1880 | 16,007 | 16.6% | |
| 1890 | 17,529 | 9.5% | |
| 1900 | 19,830 | 13.1% | |
| 1910 | 22,088 | 11.4% | |
| 1920 | 22,901 | 3.7% | |
| 1930 | 22,767 | −0.6% | |
| 1940 | 23,438 | 2.9% | |
| 1950 | 21,684 | −7.5% | |
| 1960 | 19,184 | −11.5% | |
| 1970 | 19,757 | 3.0% | |
| 1980 | 21,714 | 9.9% | |
| 1990 | 21,412 | −1.4% | |
| 2000 | 23,094 | 7.9% | |
| 2010 | 22,350 | −3.2% | |
| Est. 2016 | 21,357 | [5] | −4.4% |
| U.S. Decennial Census[6] 1790-1960[7] 1900-1990[8] 1990-2000[9] 2010-2013[1] | |||
As of the 2010 United States Census, there were 22,350 people, 8,335 households, and 5,622 families residing in the county.[10] The population density was 50.6 inhabitants per square mile (19.5/km2). There were 9,426 housing units at an average density of 21.3 per square mile (8.2/km2).[3] The racial makeup of the county was 87.9% white, 8.3% black or African American, 0.4% Asian, 0.2% American Indian, 1.6% from other races, and 1.4% from two or more races. Those of Hispanic or Latino origin made up 2.7% of the population.[10] In terms of ancestry, 32.8% were German, 14.3% were Irish, 10.6% were English, 8.1% were American, and 6.3% were Polish.[11]
Of the 8,335 households, 30.4% had children under the age of 18 living with them, 51.5% were married couples living together, 11.3% had a female householder with no husband present, 32.5% were non-families, and 28.6% of all households were made up of individuals. The average household size was 2.38 and the average family size was 2.90. The median age was 39.4 years.[10]
The median income for a household in the county was $40,696 and the median income for a family was $50,130. Males had a median income of $40,768 versus $28,377 for females. The per capita income for the county was $17,926. About 11.5% of families and 14.0% of the population were below the poverty line, including 22.6% of those under age 18 and 6.9% of those age 65 or over.[12]
Communities
Cities
Villages
Unincorporated communities
Politics
| Year | Republican | Democratic | Third Parties |
|---|---|---|---|
| 2016 | 69.4% 6,855 | 24.9% 2,462 | 5.6% 557 |
| 2012 | 57.7% 5,507 | 40.0% 3,819 | 2.3% 223 |
| 2008 | 50.9% 5,086 | 47.0% 4,701 | 2.1% 208 |
| 2004 | 53.6% 5,589 | 45.8% 4,770 | 0.6% 66 |
| 2000 | 48.3% 4,802 | 48.9% 4,862 | 2.8% 278 |
| 1996 | 32.6% 3,237 | 53.9% 5,347 | 13.5% 1,337 |
| 1992 | 28.0% 3,105 | 54.2% 6,009 | 17.8% 1,972 |
| 1988 | 46.8% 4,576 | 52.8% 5,167 | 0.4% 38 |
| 1984 | 55.9% 5,852 | 43.8% 4,584 | 0.3% 36 |
| 1980 | 55.5% 5,888 | 40.9% 4,337 | 3.6% 385 |
| 1976 | 46.4% 5,286 | 52.4% 5,976 | 1.2% 133 |
| 1972 | 63.0% 6,968 | 36.9% 4,084 | 0.1% 12 |
| 1968 | 49.0% 5,384 | 40.5% 4,449 | 10.5% 1,150 |
| 1964 | 39.2% 4,287 | 60.8% 6,639 | 0.0% 0 |
| 1960 | 57.5% 6,708 | 42.5% 4,958 | 0.1% 6 |
| 1956 | 57.1% 6,513 | 42.9% 4,901 | 0.0% 0 |
| 1952 | 55.2% 6,580 | 44.8% 5,340 | 0.0% 3 |
| 1948 | 50.0% 5,109 | 49.3% 5,043 | 0.7% 74 |
| 1944 | 57.0% 6,236 | 42.7% 4,677 | 0.3% 33 |
| 1940 | 52.4% 7,243 | 47.3% 6,539 | 0.4% 55 |
| 1936 | 42.9% 5,482 | 55.2% 7,043 | 1.9% 243 |
| 1932 | 32.9% 3,778 | 64.3% 7,400 | 2.8% 324 |
| 1928 | 47.5% 4,636 | 51.5% 5,029 | 1.0% 101 |
| 1924 | 39.8% 3,693 | 32.4% 3,007 | 27.9% 2,589 |
| 1920 | 58.5% 4,598 | 31.5% 2,478 | 10.0% 788 |
| 1916 | 49.7% 4,796 | 46.1% 4,445 | 4.2% 408 |
| 1912 | 18.9% 894 | 44.5% 2,107 | 36.6% 1,731 |
| 1908 | 46.3% 2,392 | 48.0% 2,482 | 5.7% 296 |
| 1904 | 52.7% 2,451 | 31.5% 1,466 | 15.9% 738 |
| 1900 | 48.3% 2,336 | 47.9% 2,321 | 3.8% 184 |
| 1896 | 48.6% 2,342 | 49.2% 2,370 | 2.3% 110 |
| 1892 | 44.1% 1,840 | 47.5% 1,980 | 8.4% 349 |
See also
References
- 1 2 "State & County QuickFacts". United States Census Bureau. Archived from the original on July 16, 2011. Retrieved July 8, 2014.
- ↑ "Find a County". National Association of Counties. Retrieved 2011-06-07.
- 1 2 "Population, Housing Units, Area, and Density: 2010 - County". United States Census Bureau. Retrieved 2015-07-12.
- 1 2 "Monthly Averages for Pinckneyville, Illinois". The Weather Channel. Retrieved 2011-01-27.
- ↑ "Population and Housing Unit Estimates". Retrieved June 9, 2017.
- ↑ "U.S. Decennial Census". United States Census Bureau. Retrieved July 8, 2014.
- ↑ "Historical Census Browser". University of Virginia Library. Retrieved July 8, 2014.
- ↑ "Population of Counties by Decennial Census: 1900 to 1990". United States Census Bureau. Retrieved July 8, 2014.
- ↑ "Census 2000 PHC-T-4. Ranking Tables for Counties: 1990 and 2000" (PDF). United States Census Bureau. Retrieved July 8, 2014.
- 1 2 3 "DP-1 Profile of General Population and Housing Characteristics: 2010 Demographic Profile Data". United States Census Bureau. Retrieved 2015-07-12.
- ↑ "DP02 SELECTED SOCIAL CHARACTERISTICS IN THE UNITED STATES – 2006-2010 American Community Survey 5-Year Estimates". United States Census Bureau. Retrieved 2015-07-12.
- ↑ "DP03 SELECTED ECONOMIC CHARACTERISTICS – 2006-2010 American Community Survey 5-Year Estimates". United States Census Bureau. Retrieved 2015-07-12.
- ↑ http://uselectionatlas.org/RESULTS
Places adjacent to Perry County, Illinois | ||||||||||
|---|---|---|---|---|---|---|---|---|---|---|
| ||||||||||
Municipalities and communities of Perry County, Illinois, United States | ||
|---|---|---|
| Cities | ||
| Villages | ||
| Precincts |
| |
| Unincorporated communities | ||
| Footnotes | ‡This populated place also has portions in an adjacent county or counties | |

| Counties |  | |
|---|---|---|
| Mid-sized cities (25,000+) | ||
| Small Cities (10,000-25,000) | ||
| Small Cities (5,000-10,000) | ||
| Interstates | ||
| Airports/Military bases |
| |
| Universities | ||
| Colleges | ||
| Sports teams based in the Southern Illinois | ||