United States presidential election in New York, 2016
|
| ||||||||||||||||||||||||||
| ||||||||||||||||||||||||||
| Turnout | 52.45% (estimated) | |||||||||||||||||||||||||
|---|---|---|---|---|---|---|---|---|---|---|---|---|---|---|---|---|---|---|---|---|---|---|---|---|---|---|
| ||||||||||||||||||||||||||
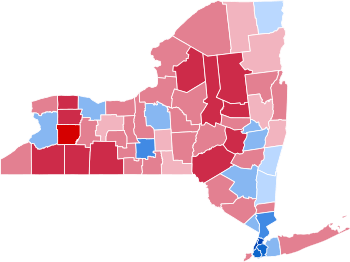 County Results
| ||||||||||||||||||||||||||
| ||||||||||||||||||||||||||

.jpg)
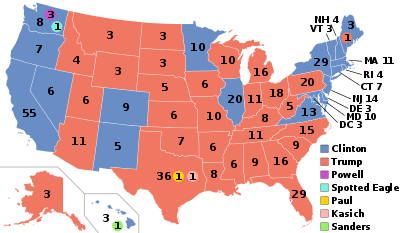
The 2016 United States presidential election in New York was held on November 8, 2016, as part of the 2016 General Election in which all 50 states plus The District of Columbia participated. New York voters chose electors to represent them in the Electoral College via a popular vote with the two major party's candidates claiming New York as their home state, the Republican Party's nominee, businessman Donald Trump, and running mate Indiana Governor Mike Pence against Democratic Party nominee, former Secretary of State Hillary Clinton and her running mate, Virginia Senator Tim Kaine.
Hillary Clinton carried New York with 59.01% of the vote, while Donald Trump received 36.52% of the vote, a 22.49% Democratic victory margin.[1]
New York State remained a solid blue state in the 2016 election, although Hillary Clinton received a smaller vote share than President Obama had in 2012, while Donald Trump slightly improved upon Mitt Romney's performance. Still, despite being born and raised in New York, and long being associated with the state, Trump decisively lost the popular vote.
This presidential election marked the first time since 1944 when both party's presidential candidates had New York as their home state. In fact, it is also the first time since 1944 when both major party candidates even shared a home state, although only Trump was born in the state of the candidates.[lower-alpha 1]
Primary elections
On April 19, 2016, in the presidential primaries, New York voters expressed their preferences for the Democratic and Republican parties' respective nominees for president. Registered members of each party only voted in their party's primary, while voters who were unaffiliated with either party didn't vote in the primary.[2]
Democratic primary
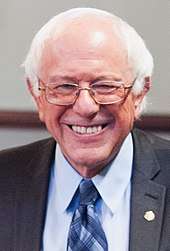
Two candidates appeared on the Democratic presidential primary ballot:[3]
Similarly to the general election, both candidates in the Democratic primary had a connection to New York, as New York was Clinton's adopted home state, and the birthplace of Sanders.
|
| |||||||||||||||||||
| |||||||||||||||||||
| |||||||||||||||||||
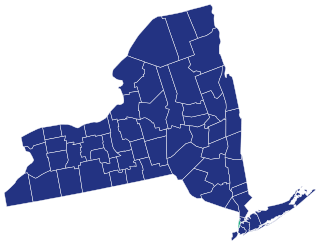
 New York results by county
Hillary Clinton Bernie Sanders | |||||||||||||||||||
| New York Democratic primary, April 19, 2016 | |||||
|---|---|---|---|---|---|
| Candidate | Popular vote | Estimated delegates | |||
| Count | Percentage | Pledged | Unpledged | Total | |
| Hillary Clinton | 1,133,980 | 57.54% | 139 | 41 | 180 |
| Bernie Sanders | 820,056 | 41.62% | 108 | 0 | 108 |
| Void | 11,306 | 0.57% | |||
| Blank Votes | 5,358 | 0.27% | |||
| Uncommitted | N/A | 0 | 3 | 3 | |
| Total | 1,970,900 | 100% | 247 | 44 | 291 |
| Source: Green Papers, New York State Board of Elections | |||||
New York City results
| 2016 Democratic primary | Manhattan | The Bronx | Brooklyn | Queens | Staten Island | Total |
| Hillary Clinton | 190,806 | 105,719 | 183,662 | 133,210 | 17,612 | 631,009 |
| 64.42% | 68.76% | 59.07% | 61.32% | 52.40% | 62.65% | |
| Bernie Sanders | 98,194 | 46,189 | 123,872 | 81,762 | 15,471 | 365,488 |
| 33.67% | 30.04% | 39.84% | 37.64% | 46.03% | 36.29% | |
| Blank, Void | 2,656 | 1,834 | 3,372 | 2,272 | 530 | 10,664 |
| 1.91% | 1.2% | 1.09% | 1.04% | 1.57% | 1.06% | |
| TOTAL | 291,656 | 153,742 | 310,906 | 217,244 | 33,613 | 1,007,161 |
| TURNOUT | 47.20% | 31.31% | 36.42% | 32.15% | 28.17% | 36.52% |
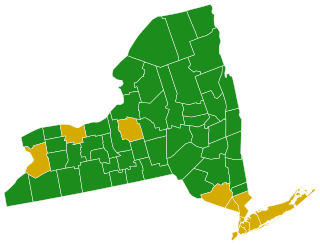
Republican primary
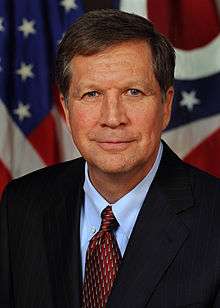
Three candidates appeared on the Republican presidential primary ballot:[3]
|
| |||||||||||||||||||||||||
| |||||||||||||||||||||||||
| |||||||||||||||||||||||||
 New York results by county
Donald Trump John Kasich | |||||||||||||||||||||||||
.jpg)
| New York Republican primary, April 19, 2016 | |||||
|---|---|---|---|---|---|
| Candidate | Votes | Percentage | Actual delegate count | ||
| Bound | Unbound | Total | |||
| 554,522 | 59.21% | 89 | 0 | 89 | |
| John Kasich | 231,166 | 24.68% | 6 | 0 | 6 |
| Ted Cruz | 136,083 | 14.53% | 0 | 0 | 0 |
| Blank & Void | 14,756 | 1.58% | 0 | 0 | 0 |
| Unprojected delegates: | 0 | 0 | 0 | ||
| Total: | 936,527 | 100.00% | 95 | 0 | 95 |
| Source: The Green Papers | |||||
Republican primary results by county
| County | Carson* | % | Cruz | % | Kasich | % | Trump | % | BVS | Total | Turnout | MV% |
|---|---|---|---|---|---|---|---|---|---|---|---|---|
| Albany | 150 | 1.04% | 2,390 | 16.58% | 5,026 | 34.87% | 6,793 | 41.13% | 55 | 14,414 | 41.25% | 12.26% |
| Allegany | 156 | 2.93% | 1,159 | 21.74% | 1,175 | 22.05% | 2,827 | 53.04% | 13 | 5,330 | 43.63% | 30.99% |
| Bronx | 127 | 1.75% | 1,164 | 16.00% | 1,148 | 15.78% | 4,730 | 65.00% | 108 | 7,277 | 19.57% | 49.00% |
| Broome | 286 | 1.55% | 3,953 | 21.45% | 5,138 | 27.88% | 8,923 | 48.42% | 130 | 18,430 | 45.32% | 20.54% |
| Cattaraugus | 113 | 1.74% | 1,298 | 19.97% | 1,419 | 21.83% | 3,636 | 55.93% | 35 | 6,501 | 38.22% | 31.10% |
| Cayuga | 70 | 1.13% | 1,136 | 18.38% | 1,942 | 31.42% | 3,024 | 48.92% | 9 | 6,181 | 37.92% | 17.51% |
| Chautauqua | 177 | 1.85% | 2,016 | 21.08% | 2,294 | 23.99% | 5,027 | 52.57% | 49 | 9,563 | 38.35% | 28.58% |
| Chemung | N/A | 1,820 | 21.16% | 2,372 | 27.58% | 4,208 | 48.92% | 201 | 8,601 | 42.99% | 21.35% | |
| Chenango | 87 | 1.64% | 1,133 | 21.31% | 1,394 | 26.22% | 2,659 | 50.02% | 43 | 5,316 | 43.33% | 23.80% |
| Clinton | N/A | 739 | 15.77% | 1,389 | 29.64% | 2,487 | 53.06% | 72 | 4,687 | 33.05% | 23.43% | |
| Columbia | 63 | 1.32% | 744 | 15.62% | 1,271 | 26.68% | 2,662 | 55.88% | 24 | 4,764 | 40.46% | 29.20% |
| Cortland | N/A | 900 | 22.66% | 1,276 | 32.13% | 1,710 | 43.06% | 85 | 3,971 | 41.05% | 10.93% | |
| Delaware | 91 | 1.85% | 846 | 17.19% | 1,142 | 23.21% | 2,831 | 57.53% | 11 | 4,921 | 42.63% | 34.32% |
| Dutchess | 213 | 1.05% | 2,840 | 13.94% | 4,401 | 21.60% | 12,872 | 63.18% | 46 | 20,372 | 40.07% | 41.58% |
| Erie | N/A | 7,964 | 12.93% | 13,136 | 21.33% | 39,589 | 64.27% | 907 | 61,596 | 42.04% | 42.95% | |
| Essex | 68 | 1.71% | 664 | 16.72% | 1,274 | 32.07% | 1,918 | 48.29% | 48 | 3,972 | 36.82% | 16.21% |
| Franklin | 62 | 2.27% | 433 | 15.83% | 763 | 27.90% | 1,460 | 53.38% | 17 | 2,735 | 32.34% | 25.48% |
| Fulton | 72 | 1.17% | 1,036 | 16.85% | 1,552 | 25.24% | 3,456 | 56.20% | 34 | 6,150 | 39.59% | 30.96% |
| Genesee | N/A | 1,032 | 16.54% | 1,282 | 20.54% | 3,815 | 61.13% | 112 | 6,241 | 40.16% | 40.59% | |
| Greene | N/A | 705 | 16.39% | 838 | 19.48% | 2,689 | 62.52% | 69 | 4,301 | 37.08% | 43.04% | |
| Hamilton | N/A | 210 | 18.77% | 326 | 29.13% | 565 | 50.49% | 18 | 1,119 | 44.89% | 21.36% | |
| Herkimer | 107 | 1.47% | 1,042 | 14.35% | 1,877 | 25.85% | 4,193 | 57.75% | 42 | 7,261 | 41.32% | 31.90% |
| Jefferson | 121 | 1.28% | 1,235 | 13.10% | 2,860 | 30.34% | 5,190 | 55.07% | 19 | 9,425 | 41.69% | 24.72% |
| Kings (Brooklyn) | 255 | 1.01% | 4,872 | 19.32% | 4,024 | 15.96% | 15,920 | 63.14% | 144 | 25,215 | 25.12% | 43.82% |
| Lewis | 71 | 2.29% | 476 | 15.36% | 898 | 28.99% | 1,643 | 53.03% | 10 | 3,098 | 36.49% | 24.05% |
| Livingston | 116 | 1.62% | 1,329 | 18.54% | 1,724 | 24.05% | 3,957 | 55.20% | 43 | 7,169 | 43.60% | 31.15% |
| Madison | N/A | 1,358 | 19.87% | 2,214 | 32.39% | 3,108 | 45.47% | 155 | 6,835 | 43.72% | 13.08% | |
| Monroe | 685 | 1.24% | 9,537 | 17.23% | 16,870 | 30.47% | 28,034 | 50.63% | 239 | 55,365 | 43.98% | 20.16% |
| Montgomery | 42 | 1.12% | 793 | 21.15% | 865 | 23.07% | 2,039 | 54.39% | 10 | 3,749 | 39.85% | 31.32% |
| Nassau | N/A | 9,902 | 9.54% | 22,722 | 21.90% | 69,692 | 67.17% | 1,437 | 103,753 | 32.35% | 45.27% | |
| New York (Manhattan) | 254 | 0.93% | 3,586 | 13.08% | 12,181 | 44.43% | 11,196 | 40.84% | 198 | 27,415 | 32.30% | -3.59% |
| Niagara | 245 | 1.40% | 2,406 | 13.78% | 3,321 | 19.02% | 11,450 | 65.56% | 43 | 17,465 | 41.26% | 46.54% |
| Oneida | 252 | 1.23% | 3,335 | 16.33% | 5,398 | 26.44% | 11,332 | 55.50% | 102 | 20,419 | 43.10% | 29.06% |
| Onondaga | 307 | 0.91% | 6,075 | 17.97% | 12,055 | 35.67% | 15,155 | 44.84% | 207 | 33,799 | 41.76% | 9.17% |
| Ontario | 180 | 1.60% | 2,061 | 18.37% | 3,380 | 30.13% | 5,558 | 49.55% | 39 | 11,218 | 43.02% | 19.42% |
| Orange | 217 | 0.89% | 3,120 | 12.75% | 4,372 | 17.87% | 16,659 | 68.07% | 104 | 24,472 | 35.94% | 50.21% |
| Orleans | 61 | 1.45% | 720 | 16.65% | 799 | 18.95% | 2,643 | 62.69% | 11 | 4,216 | 40.68% | 43.74% |
| Oswego | 188 | 1.57% | 2,026 | 16.88% | 3,285 | 27.37% | 6,423 | 53.52% | 80 | 12,002 | 38.57% | 26.15% |
| Ostego | 96 | 1.78% | 1,035 | 19.20% | 1,516 | 28.12% | 2,719 | 50.43% | 26 | 5,392 | 41.92% | 22.31% |
| Putnam | 61 | 0.70% | 986 | 11.36% | 1,587 | 18.28% | 6,027 | 69.44% | 19 | 8,680 | 40.96% | 51.15% |
| Queens | 342 | 1.08% | 4,495 | 14.20% | 5,601 | 17.69% | 20,951 | 66.18% | 268 | 31,657 | 27.36% | 48.49% |
| Rensselaer | 100 | 1.10% | 1,576 | 17.27% | 2,600 | 28.48% | 4,758 | 52.13% | 94 | 9,128 | 38.70% | 23.64% |
| Richmond (Staten Island) | 120 | 0.45% | 2,096 | 7.90% | 2,690 | 10.14% | 21,521 | 81.09% | 114 | 26,541 | 34.76% | 70.95% |
| Rockland | 104 | 0.70% | 2,367 | 15.92% | 3,158 | 21.24% | 9,219 | 62.00% | 21 | 14,869 | 34.71% | 40.76% |
| St. Lawrence | 124 | 1.74% | 1,074 | 15.04% | 2,036 | 28.52% | 3,825 | 53.58% | 80 | 7,139 | 36.07% | 25.06% |
| Saratoga | 240 | 0.97% | 4,404 | 17.85% | 8,272 | 33.52% | 11,673 | 47.30% | 88 | 24,677 | 41.91% | 13.78% |
| Schenectady | N/A | 2,010 | 20.93% | 2,946 | 30.67% | 4,496 | 46.81% | 152 | 9,604 | 41.32% | 16.14% | |
| Schoharie | N/A | 640 | 22.74% | 638 | 22.66% | 1,497 | 53.18% | 40 | 2,815 | 39.99% | 30.44% | |
| Schuyler | 42 | 2.21% | 405 | 21.35% | 461 | 24.30% | 979 | 51.61% | 10 | 1,897 | 40.85% | 27.31% |
| Seneca | 56 | 1.85% | 521 | 17.21% | 854 | 28.20% | 1,585 | 52.34% | 12 | 3,028 | 40.86% | 24.14% |
| Steuben | 262 | 2.24% | 2,401 | 20.50% | 2,755 | 23.52% | 6,252 | 53.37% | 44 | 11,714 | 42.09% | 29.85% |
| Suffolk | 735 | 0.73% | 9,099 | 9.01% | 18,694 | 18.52% | 72,359 | 71.67% | 77 | 100,964 | 34.15% | 53.15% |
| Sullivan | N/A | 534 | 13.19% | 687 | 16.98% | 2,742 | 67.75% | 84 | 4,047 | 33.08% | 50.78% | |
| Tioga | 126 | 2.09% | 1,429 | 23.68% | 1,546 | 25.62% | 2,926 | 48.48% | 8 | 6,035 | 44.66% | 22.87% |
| Tompkins | 105 | 2.11% | 1,342 | 26.96% | 1,691 | 33.98% | 1,821 | 36.59% | 18 | 4,977 | 42.82% | 2.61% |
| Ulster | 142 | 1.41% | 1,332 | 13.19% | 2,197 | 21.75% | 6,388 | 63.24% | 43 | 10,102 | 36.63% | 41.49% |
| Warren | 101 | 1.28% | 1,206 | 15.28% | 2,772 | 35.12% | 3,761 | 47.64% | 54 | 7,894 | 42.15% | 12.53% |
| Washington | 7 | 0.13% | 1,048 | 19.15% | 1,839 | 33.61% | 2,458 | 44.92% | 120 | 5,472 | 37.60% | 11.31% |
| Wayne | N/A | 1,627 | 19.99% | 2,016 | 24.77% | 4,472 | 54.94% | 156 | 8,271 | 38.12% | 30.17% | |
| Westchester | 376 | 0.83% | 5,245 | 11.59% | 13,599 | 30.06% | 25,880 | 57.20% | 147 | 45,247 | 35.31% | 27.14% |
| Wyoming | N/A | 749 | 17.40% | 724 | 16.82% | 2,752 | 63.94% | 79 | 4,304 | 40.10% | 46.54% | |
| Yates | 43 | 1.56% | 425 | 15.44% | 884 | 32.11% | 1,388 | 50.42% | 13 | 2,753 | 43.29% | 18.31% |
| Total | 8,018* | 0.86% | 136,083 | 14.53% | 231,166 | 24.69% | 554,522 | 59.22% | 6,636 | 936,525 | 36.35% | 34.53% |
*Note: Blank, Void, and Scattering (BVS) votes include some votes for Former Candidate Ben Carson. Carson vote totals are unavailable in some county canvass returns. Only those available are posted. New York is a Closed primary state, meaning that the turnout is based on Active Republican Voters on April 1, 2016
New York City results
| 2016 Republican Primary | Manhattan | The Bronx | Brooklyn | Queens | Staten Island | Total |
| Donald Trump | 11,196 | 4,730 | 15,920 | 20,951 | 21,521 | 74,318 |
| 40.84% | 65.00% | 63.14% | 66.18% | 81.09% | 62.93% | |
| John Kasich | 12,181 | 1,148 | 4,024 | 5,601 | 2,096 | 25,644 |
| 44.43% | 15.78% | 15.96% | 17.69% | 10.14% | 21.71% | |
| Ted Cruz | 3,586 | 1,164 | 4,872 | 4,495 | 2,096 | 16,213 |
| 13.08% | 16.00% | 19.32% | 14.20% | 7.90% | 13.73% | |
| Ben Carson | 254 | 127 | 255 | 342 | 120 | 1,098 |
| 0.93% | 1.75% | 1.01% | 1.08% | 0.45% | 0.93% | |
| Blank, Void | 198 | 108 | 144 | 268 | 114 | 832 |
| 0.72% | 1.48% | 0.57% | 0.85% | 0.43% | 0.70% | |
| TOTAL | 27,415 | 7,277 | 25,215 | 31,657 | 26,541 | 118,105 |
| TURNOUT | 32.30% | 19.57% | 25.12% | 27.36% | 34.76% | 28.49% |
General election
Polling
Polls have projected New York to remain safely in the Democratic column for former Senator Hillary Clinton, despite it also being the home state of Donald Trump for his entire life.
Debate
The first Presidential Debate took place at Hofstra University. Snap polls indicated that Clinton won.
Candidates
New York is a fusion state, which means that candidates are allowed to be on multiple lines. Those on the ballot were:
Democratic, Women's Equality and Working Families Parties
Conservative and Republican parties
Green party
Independence and Libertarian parties
Gary Johnson and Bill Weld were nominated by the Libertarian and Independence Parties using separate elector slates. Their votes have been added together in the below table for convenience. [4]
With the introduction of computerized voting, write-in candidates were permitted. The following is a certified list of persons who made valid presidential write in filings with the State Board of Elections[5]
- Arantxa Aranja
- Neer R. Asherie
- Mark Blickley
- Robert L. Buchanan
- Gary S. Canns
- Willie Carter
- Darrell Castle
- Ariel T. Cohen
- William J. Connolly
- Rocky De La Fuente
- Jason Fried
- Zoltan Istvan Gyurko
- Ben Hartnell
- Tom Hoefling
- Michael Frederick Ingbar
- Lynn Kahn
- Chris Keniston
- Gloria La Riva
- Jeffrey Mackler
- Mike Maturen
- Evan McMullin
- Monica Moorehead
- Jason Mutford
- Clifton Roberts
- Marshall Schoenke
- Ryan Alan Scott
- Emidio Soltysik
- Tony Valdivia
- J. J. Vogel-Walcutt
- Esther Welsh
- Barbara Whitaker
- Robert M. Wolff
According to the New York Times, only 300 write-in votes were counted in 2012,[6] while 63,239 were recorded as "Blank, Void or Scattering".[7]
Results
| United States presidential election in New York, 2016 [8] | ||||||
|---|---|---|---|---|---|---|
| Party | Candidate | Running mate | Votes | Percentage | Electoral votes | |
| Democratic | Hillary Clinton | 4,379,783 | 57.08% | |||
| Working Families | Hillary Clinton | 140,043 | 1.83% | |||
| Women's Equality | Hillary Clinton | 36,292 | 0.47% | |||
| Total | Hillary Clinton | Tim Kaine | 4,556,124 | 59.01% | 29 | |
| Republican | Donald Trump | 2,527,141 | 32.93% | |||
| Conservative | Donald Trump | 292,392 | 3.81% | |||
| Total | Donald Trump | Mike Pence | 2,819,534 | 36.52% | 0 | |
| Independence | Gary Johnson | 119,160 | 1.55% | 0 | ||
| Libertarian | Gary Johnson | 57,438 | 0.75% | 0 | ||
| Total | Gary Johnson | Bill Weld | 176,598 | 2.29% | ||
| Green | Jill Stein | Ajamu Baraka | 107,934 | 1.40% | 0 | |
| Write-In | Evan McMullin | 10,373 | 0.13% | 0 | ||
| Others / Write-Ins | Others / Write-Ins | 50,890 | 0.66% | 0 | ||
| Totals | 7,721,453 | 100.00% | 29 | |||
Results by County
| County | Clinton% | Clinton# | Trump% | Trump# | Johnson% | Johnson# | Stein% | Stein# | Others% | Others# |
|---|---|---|---|---|---|---|---|---|---|---|
| Albany | 59.41% | 83,071 | 34.19% | 47,808 | 3.43% | 4,792 | 1.77% | 2,475 | 0.23% | 317 |
| Allegany | 26.12% | 4,882 | 67.01% | 12,525 | 3.93% | 735 | 1.47% | 275 | 0.05% | 9 |
| Bronx | 88.52% | 353,646 | 9.46% | 37,797 | 0.58% | 2,312 | 1.09% | 4,341 | 0.04% | 154 |
| Broome | 45.56% | 39,212 | 47.57% | 40,943 | 3.77% | 3,246 | 1.80% | 1,546 | 0.30% | 258 |
| Cattaraugus | 30.48% | 9,497 | 63.19% | 19,692 | 4.00% | 1,246 | 1.41% | 440 | 0.25% | 79 |
| Cayuga | 40.76% | 13,522 | 52.41% | 17,384 | 4.09% | 1,358 | 1.51% | 501 | 0.28% | 94 |
| Chautauqua | 35.20% | 19,091 | 58.25% | 31,594 | 4.06% | 2,203 | 1.40% | 757 | 0.19% | 104 |
| Chemung | 38.09% | 13,757 | 55.64% | 20,097 | 4.01% | 1,447 | 1.28% | 463 | 0.25% | 92 |
| Chenango | 33.61% | 6,775 | 59.13% | 11,921 | 4.54% | 916 | 1.78% | 358 | 0.09% | 19 |
| Clinton | 46.91% | 15,059 | 45.01% | 14,449 | 4.09% | 1,312 | 1.91% | 613 | 0.21% | 68 |
| Columbia | 49.46% | 15,284 | 44.51 | 13,756 | 3.05% | 944 | 1.94% | 598 | 0.25% | 76 |
| Cortland | 43.33% | 8,771 | 48.90% | 9,900 | 4.73% | 957 | 1.85% | 374 | 0.01% | 3 |
| Delaware | 33.48% | 6,627 | 60.34% | 11,942 | 3.28% | 650 | 1.90% | 377 | 0.27% | 53 |
| Dutchess | 47.54% | 62,285 | 47.19% | 61,821 | 2.75% | 3,602 | 1.52% | 1,988 | 0.23% | 303 |
| Erie | 50.86% | 215,456 | 44.45 | 188,303 | 3.00% | 12,720 | 1.50% | 6,367 | 0.18% | 779 |
| Essex | 45.08% | 7,762 | 46.22% | 7,958 | 4.23% | 728 | 2.44% | 420 | 0.28% | 48 |
| Franklin | 43.05% | 7,297 | 48.50% | 8,221 | 4.23% | 717 | 2.12% | 359 | 0.27% | 46 |
| Fulton | 30.62% | 6,496 | 63.46% | 13,462 | 3.67% | 779 | 1.47% | 311 | 0.09% | 20 |
| Genessee | 28.94% | 7,650 | 63.99% | 16,915 | 4.99% | 1,319 | 1.23% | 324 | 0.18% | 47 |
| Greene | 33.58% | 7,405 | 59.29% | 13,073 | 2.93% | 647 | 1.80% | 398 | 0.12% | 27 |
| Hamilton | 29.43% | 949 | 64.00% | 2,064 | 3.69% | 119 | 1.36% | 44 | 0% | 0 |
| Herkimer | 30.79% | 8,083 | 63.60% | 16,699 | 3.82% | 1,002 | 1.53% | 403 | 0.26% | 68 |
| Jefferson | 36.12% | 13,809 | 56.92% | 21,763 | 4.37% | 1,670 | 1.61% | 617 | 0.21% | 80 |
| Kings | 79.51% | 640,553 | 17.51% | 141,044 | 0.85% | 6,864 | 1.48% | 11,932 | 0.08% | 661 |
| Lewis | 27.78% | 3,146 | 65.34% | 7,400 | 4.38% | 496 | 1.17% | 132 | 0.09% | 10 |
| Livingston | 35.62% | 10,697 | 57.57% | 17,290 | 4.25% | 1,276 | 1.50% | 449 | 0.06% | 17 |
| Madison | 38.81% | 11,667 | 53.01% | 15,936 | 5.26% | 1,582 | 1.72% | 516 | 0.05% | 15 |
| Monroe | 54.23% | 188,592 | 39.27% | 136,582 | 3.80% | 13,205 | 1.52% | 5,289 | 0.05% | 186 |
| Montgomery | 34.61% | 6,595 | 59.31% | 11,301 | 3.62% | 690 | 1.41% | 268 | 0.28% | 53 |
| Nassau | 51.33% | 332,154 | 45.13% | 292,025 | 1.75% | 11,337 | 1.04% | 6,734 | 0.11% | 683 |
| New York | 86.56% | 579,013 | 9.71% | 64,930 | 1.41% | 9,408 | 1.41% | 9,441 | 0.16% | 1,051 |
| Niagara | 38.48% | 35,559 | 56.23% | 51,961 | 3.10% | 2,865 | 1.39% | 1,287 | 0.14% | 129 |
| Oneida | 37.08% | 33,743 | 56.52% | 51,437 | 4.12% | 3,754 | 1.36% | 1,235 | 0.21% | 187 |
| Onondaga | 53.89% | 112,337 | 40.13% | 83,649 | 4.09% | 8,524 | 1.53% | 3,185 | 0.06% | 121 |
| Ontario | 42.33% | 22,233 | 49.55% | 26,029 | 4.73% | 2,846 | 1.62% | 852 | 0.08% | 40 |
| Orange | 44.91% | 68,278 | 50.42% | 76,645 | 2.54% | 3,867 | 1.42% | 2,154 | 0.12% | 176 |
| Orleans | 27.29% | 4,470 | 66.76% | 10,936 | 4.15% | 680 | 1.12% | 184 | 0.18% | 30 |
| Oswego | 35.48% | 17,095 | 57.47% | 27,688 | 4.44% | 2,137 | 1.46% | 705 | 0.33% | 158 |
| Otsego | 40.72% | 10,451 | 51.85% | 13,308 | 4.15% | 1,066 | 2.03% | 520 | 0.27% | 70 |
| Putnam | 39.88% | 19,366 | 55.65% | 27,024 | 2.41% | 1,171 | 1.21% | 590 | 0.12% | 57 |
| Queens | 75.35% | 517,220 | 21.76% | 149,341 | 1.04% | 7,116 | 1.34% | 9,230 | 0.08% | 576 |
| Rensselaer | 45.72% | 32,717 | 47.13% | 33,726 | 4.11% | 2,944 | 1.89% | 1,355 | 0.21% | 150 |
| Richmond | 40.97% | 74,143 | 56.05% | 101,437 | 1.34% | 2,432 | 1.04% | 1,886 | 0.10% | 176 |
| Rockland | 51.33% | 69,342 | 45.09% | 60,911 | 1.69% | 2,284 | 1.00% | 1,348 | 0.14% | 193 |
| St. Lawrence | 42.11% | 16,488 | 50.93% | 19,942 | 3.69% | 1,445 | 2.06% | 807 | 0.20% | 79 |
| Saratoga | 44.62% | 50,913 | 47.83% | 54,575 | 4.48% | 5,116 | 1.60% | 1,825 | 0.05% | 59 |
| Schenectady | 50.16% | 33,747 | 43.03% | 28,953 | 3.90% | 2,624 | 1.68% | 1,127 | 0.24% | 159 |
| Schoharie | 30.18% | 4,240 | 62.85% | 8,831 | 3.78% | 531 | 1.95% | 274 | 0.11% | 15 |
| Schuyler | 35.24% | 3,091 | 57.57% | 5,050 | 3.52% | 309 | 2.46% | 216 | 0.27% | 24 |
| Seneca | 40.75% | 5,697 | 51.76% | 7,236 | 4.56% | 638 | 1.85% | 259 | 0.04% | 6 |
| Steuben | 29.82% | 12,526 | 63.88% | 26,831 | 3.97% | 1,666 | 1.39% | 585 | 0.25% | 103 |
| Suffolk | 44.62% | 303,951 | 51.46% | 350,570 | 2.04% | 13,916 | 1.19% | 8,099 | 0.09% | 615 |
| Sullivan | 41.96% | 12,568 | 53.18% | 15,931 | 2.45% | 734 | 1.68% | 504 | 0.08% | 24 |
| Tioga | 33.75% | 7,526 | 59.46% | 13,260 | 4.17% | 930 | 1.51% | 337 | 0.24% | 54 |
| Tompkins | 67.69% | 28,890 | 24.30% | 10,371 | 3.26% | 1,393 | 3.23% | 1,380 | 0.04% | 19 |
| Ulster | 52.29% | 44,597 | 41.32% | 35,239 | 2.80% | 2,392 | 2.52% | 2,147 | 0.17% | 147 |
| Warren | 41.68% | 13,091 | 50.15% | 15,751 | 4.00% | 1,255 | 1.27% | 863 | 0.26% | 81 |
| Washington | 37.09% | 9,098 | 55.49% | 13,610 | 3.78% | 926 | 2.36% | 236 | 0.03% | 7 |
| Wayne | 33.95% | 13,473 | 58.91% | 23,380 | 4.82% | 1,911 | 1.43% | 567 | 0.07% | 29 |
| Westchester | 64.88% | 272,926 | 31.20% | 131,238 | 1.91% | 8,042 | 1.04% | 4,358 | 0.14% | 602 |
| Wyoming | 22.57% | 3,904 | 71.93% | 12,442 | 3.89% | 673 | 1.04% | 180 | 0.20% | 317 |
| Yates | 36.35% | 3,659 | 56.23% | 5,660 | 4.91% | 494 | 1.45% | 146 | 0.06% | 6 |
By congressional district
Clinton won 18 of 27 congressional districts.[10]
| District | Trump | Clinton | Representative |
|---|---|---|---|
| 1st | 54% | 42% | Lee Zeldin |
| 2nd | 53% | 44% | Peter T. King |
| 3rd | 45% | 51% | Steve Israel |
| Thomas Suozzi | |||
| 4th | 43% | 53% | Kathleen Rice |
| 5th | 36% | 63% | Gregory W. Meeks |
| 6th | 32% | 65% | Grace Meng |
| 7th | 10% | 86% | Nydia Velázquez |
| 8th | 13% | 84% | Hakeem Jeffries |
| 9th | 14% | 83% | Yvette Clarke |
| 10th | 19% | 78% | Jerrold Nadler |
| 11th | 53% | 44% | Dan Donovan |
| 12th | 13% | 82% | Carolyn Maloney |
| 13th | 5% | 92% | Charles B. Rangel |
| Adriano Espaillat | |||
| 14th | 22% | 77% | Joseph Crowley |
| 15th | 5% | 94% | Jose Serrano |
| 16th | 22% | 75% | Eliot L. Engel |
| 17th | 38% | 58% | Nita Lowey |
| 18th | 49% | 47% | Sean Patrick Maloney |
| 19th | 51% | 44% | John Faso |
| 20th | 40% | 53% | Paul Tonko |
| 21st | 53% | 39% | Elise Stefanik |
| 22nd | 54% | 39% | Richard L. Hanna |
| Claudia Tenney | |||
| 23rd | 54% | 39% | Tom Reed |
| 24th | 45% | 49% | John Katko |
| 25th | 39% | 55% | Louise Slaughter |
| 26th | 38% | 58% | Brian Higgins |
| 27th | 59% | 35% | Chris Collins |
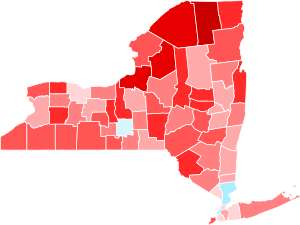
Reflecting a strong nationwide trend of rural areas swinging hard against Clinton, Trump improved greatly upon recent Republican performances in rural Upstate New York. Upstate New York was historically a staunchly Republican region, although it had been trending Democratic since the 1990s, and Democrat Barack Obama had twice performed very strongly across both urban and rural upstate in the preceding two elections. Trump won 20 counties in New York State that voted for President Obama in 2012, 18 of which were rural upstate counties.
Clinton did win Upstate New York's traditionally Democratic cities and hold onto urban counties upstate. However Trump nevertheless also made gains in urban parts of upstate, which had long been in economic decline, due to his strength in economically distressed areas and his appeal to working class whites who traditionally vote Democratic. Trump's message on trade policy and pledge to halt job outsourcing appealed strongly to the Rust Belt region of the United States, where many local economies had been ravaged by loss of industrial jobs, which extends into Upstate New York cities like Buffalo, Rochester, and Syracuse. In Erie County, where Buffalo is located in Western New York bordering the Great Lakes, Clinton won only 51-44 compared with Obama's 57-41 victory in 2012. Clinton suffered her strongest swings against her in traditionally Democratic Northern New York along the Saint Lawrence River, becoming the first Democrat to lose Franklin County and St. Lawrence County since Michael Dukakis in 1988. Trump won St. Lawrence County 51-42, where Obama had won 57-41, and Franklin County 48-43, where Obama had won 62-36. Clinton barely held onto neighboring Clinton County 47-45, which Obama had also won 62-36.
The only upstate county where Clinton won by a stronger margin than Obama had in 2012 was the liberal Democratic stronghold of Tompkins County, home to the college town of Ithaca where Cornell University is located. Clinton and Obama both received 68% in the county, but Trump's unpopularity with young people and students led him to fall to only 24% of the vote compared with 28% for Romney.
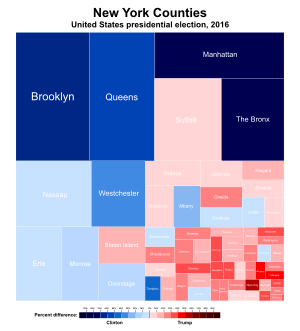
Hillary Clinton's landslide statewide win was powered by an overwhelmingly lopsided victory in the massively populated five boroughs of New York City, the largest city in the United States, despite Donald Trump's longtime popular cultural association with the city. In New York City, Hillary Clinton received 2,164,575 votes (79.0% of the vote) compared with only 494,549 votes (18.0% of the vote) for Donald Trump. This represented a slight fall from Barack Obama's historic 81.2% in the city in 2012, and the borough of Staten Island flipped from Obama to Trump, however Trump’s percentage was virtually unchanged from Romney's 17.8%, and with huge victories in four boroughs Clinton's 60.9% victory margin over Trump was a slight decrease from Obama's record 63.4% margin over Romney, making Clinton's win the second-widest victory margin for a presidential candidate in New York City history.
Trump's birthplace borough of Queens gave Clinton over 75% of the vote and less than 22% to Trump. In Manhattan, home to Trump Tower, Trump's famous landmark residence, Clinton received nearly 87% while Trump received less than 10% of the vote, the worst performance ever for a major party presidential candidate in Manhattan. This made Trump's home borough one of only 3 counties in the state where Trump did worse than Mitt Romney had in 2012.
In the populous suburbs around New York City, Hillary Clinton won overall, although with the sole exception of her county of residence, there were strong swings against her compared with President Obama's performance. The downstate suburban counties around the city were historically Republican bastions, until Hillary's husband Bill Clinton made dramatic suburban gains for Democrats in the 1990s and easily swept every suburban New York county in his 1996 re-election campaign. North of the city, Clinton significantly further improved on Barack Obama's landslide margin in wealthy Westchester County, where the Clintons own their primary residence in Chappaqua, New York. Clinton won Westchester County 65-31 compared with Obama's 62-37 victory over Mitt Romney. Conversely, Trump made major gains on Long Island. Clinton won Nassau County by only a slightly reduced 6-point margin rather than the 8-point margin by which Obama had won it. However Suffolk County swung heavily to Trump, from a 51-47 win for Obama to a 51-45 win for Trump, the first time a Republican won Suffolk County since Bill Clinton narrowly lost it to George H.W. Bush by 1.5% in 1992.
While heavily Democratic New York City had secured consistent Democratic landslides in New York State for 3 decades, since 1992 every Democratic presidential candidate would have still carried New York State even without the massive Democratic vote margins provided by the 5 boroughs, albeit by substantially closer margins. In 2012, Obama won New York State outside of New York City with 54.03% of the vote compared with Mitt Romney's 44.54%. With Donald Trump having made major gains over Romney's performance across Upstate New York and improving overall in suburban downstate, Hillary Clinton was heavily dependent on New York City for her victory, receiving 2,191,869 votes to Trump's 467,254 votes, a citywide margin of 1,724,416 votes. However although just barely, Clinton did manage to continue the Democratic winning streak in New York State outside of New York City. Removing the 5 boroughs of New York City from the result, Clinton received 2,355,349 votes while Trump received 2,347,092 votes, meaning Clinton would have won New York State without the city by 8,257 votes, a margin of 0.17% out of all statewide votes cast outside of the city.
See also
Footnotes
- ↑ Both of the major party 1988 election candidates George H. W. Bush and Michael Dukakis were born in Massachusetts, and Bush was a Texas resident at the time of the election
References
- ↑ "2016 Presidential General Election Results". U.S. Election Atlas. Retrieved 6 Dec 2016.
- ↑ "The Green Papers Presidential Primaries, Caucuses, and Conventions". The Green Papers. 2016. Retrieved January 27, 2016.
- 1 2 "Candidate Petition List". 21 May 2016. Retrieved 22 May 2016.
- ↑ http://www.politico.com/states/new-york/albany/story/2016/09/gary-johnsons-votes-wont-be-aggregated-in-new-york-105521
- ↑ https://www.elections.ny.gov/NYSBOE/download/law/OfficialPresidentialWrite-Ins2016.pdf
- ↑ https://www.nytimes.com/2016/11/03/nyregion/new-york-today-other-presidential-candidates.html?_r=0
- ↑ https://www.elections.ny.gov/NYSBOE/elections/2012/General/President_07292013.pdf
- ↑ https://www.elections.ny.gov/NYSBOE/elections/2016/General/2016President.pdf
- ↑ US Elections Atlas
- ↑ https://www.cookpolitical.com/introducing-2017-cook-political-report-partisan-voter-index
External links
- RNC 2016 Republican Nominating Process
- Green papers for 2016 primaries, caucuses, and conventions
- 2016 Presidential primaries, ElectionProjection.com
State results of the 2016 U.S. presidential election | ||
|---|---|---|
|  | |