United States presidential election in North Carolina, 2016
|
| ||||||||||||||||||||||||||
| ||||||||||||||||||||||||||
| Turnout |
68.98% | |||||||||||||||||||||||||
|---|---|---|---|---|---|---|---|---|---|---|---|---|---|---|---|---|---|---|---|---|---|---|---|---|---|---|
| ||||||||||||||||||||||||||
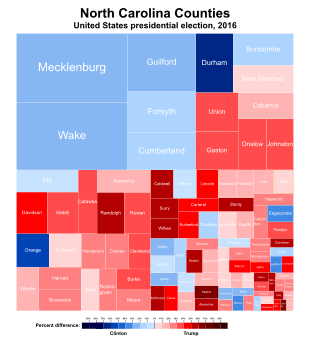
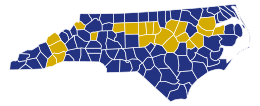
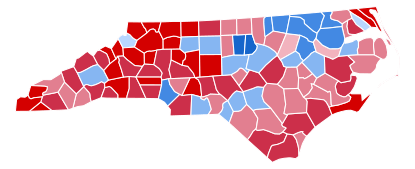 County results
| ||||||||||||||||||||||||||
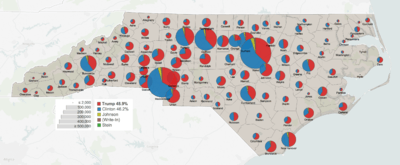 Results by county showing number of votes by size and candidates by color | ||||||||||||||||||||||||||
| ||||||||||||||||||||||||||
.jpg)

| Elections in North Carolina | ||||||||
|---|---|---|---|---|---|---|---|---|
 | ||||||||
|
||||||||
|
State legislature
|
||||||||
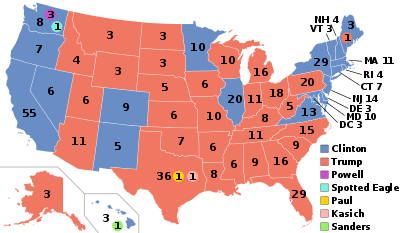
The 2016 United States presidential election in North Carolina was won by Republican nominee Donald Trump on November 8, 2016, with a 3.67% winning margin, as part of the 2016 general election. North Carolina voters chose 15 electors to represent them in the Electoral College via a popular vote.
Primary elections
The Democratic, Republican, and Libertarian primaries were on March 15, 2016. In North Carolina, registered members of each party only voted in their party's primary, while voters who were unaffiliated chose any one primary in which to vote.
Democratic primary
Four candidates appeared on the Democratic presidential primary ballot:[1][2]
Polling
According to a WRAL-TV/SurveyUSA poll conducted the week before the primary: "[Hillary] Clinton holds a commanding lead of 57 percent to 34 percent among likely Democratic voters over U.S. Sen. Bernie Sanders of Vermont." [3]
Results
| Party | Candidate | Votes | % | |
|---|---|---|---|---|
| Democratic | Hillary Clinton | 616,758 | 54.59% | |
| Democratic | Bernie Sanders | 460,434 | 40.75% | |
| Democratic | No Preference | 37,200 | 3.29% | |
| Democratic | Others (total) | 15,375 | 1.37% | |
| Total votes | 1,129,767 | 100.00% | ||
Republican primary
Twelve candidates appeared on the Republican presidential primary ballot:[1][2][5]
- Jeb Bush (withdrawn)
- Ben Carson (withdrawn)
- Chris Christie (withdrawn)
- Ted Cruz
- Carly Fiorina (withdrawn)
- Jim Gilmore (withdrawn)
- Mike Huckabee (withdrawn)
- John Kasich
- Rand Paul (withdrawn)
- Marco Rubio
- Rick Santorum (withdrawn)
- Donald Trump
Polling
According to a WRAL-TV/SurveyUSA poll conducted the week before the primary: "[Donald] Trump tops U.S. Sen. Ted Cruz of Texas 41 percent to 27 percent among likely GOP voters. U.S. Sen. Marco Rubio of Florida and Ohio Gov. John Kasich trail far behind, at 14 and 11 percent, respectively." [3]
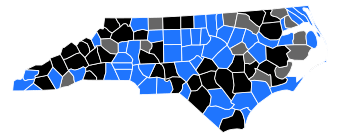
Results
| North Carolina Republican primary, March 15, 2016 | |||||
|---|---|---|---|---|---|
| Candidate | Votes | Percentage | Actual delegate count | ||
| Bound | Unbound | Total | |||
| 462,413 | 40.23% | 29 | 0 | 29 | |
| Ted Cruz | 422,621 | 36.76% | 27 | 0 | 27 |
| John Kasich | 145,659 | 12.67% | 9 | 0 | 9 |
| Marco Rubio | 88,907 | 7.73% | 6 | 0 | 6 |
| Ben Carson (withdrawn) | 11,019 | 0.96% | 1 | 0 | 1 |
| No Preference | 6,081 | 0.53% | 0 | 0 | 0 |
| Jeb Bush (withdrawn) | 3,893 | 0.34% | 0 | 0 | 0 |
| Mike Huckabee (withdrawn) | 3,071 | 0.27% | 0 | 0 | 0 |
| Rand Paul (withdrawn) | 2,753 | 0.24% | 0 | 0 | 0 |
| Chris Christie (withdrawn) | 1,256 | 0.11% | 0 | 0 | 0 |
| Carly Fiorina (withdrawn) | 929 | 0.08% | 0 | 0 | 0 |
| Rick Santorum (withdrawn) | 663 | 0.06% | 0 | 0 | 0 |
| Jim Gilmore (withdrawn) | 265 | 0.02% | 0 | 0 | 0 |
| Unprojected delegates: | 0 | 0 | 0 | ||
| Total: | 1,149,530 | 100.00% | 72 | 0 | 72 |
| Source: The Green Papers | |||||
Trump managed to pull off a closer than expected win due to both Cruz and his campaigns performances in different metropolitan areas. Trump was strongest in the Charlotte, Fayetteville and Wilmington areas. Cruz did best in Greensboro, Asheville and the Research Triangle region, where North Carolina's major colleges and capitol of Raleigh are located.[6]
Libertarian primary
|
| |||||||||||||||||||||||||||||||||||
| |||||||||||||||||||||||||||||||||||
| |||||||||||||||||||||||||||||||||||
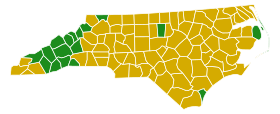
 North Carolina results by county
Gary Johnson
No Preference
Tie | |||||||||||||||||||||||||||||||||||


Eleven candidates appeared on the Libertarian presidential primary ballot:[1][2]
- John David Hale
- Cecil Ince
- Gary Johnson
- Steve Kerbel
- Darryl W. Perry
- Austin Petersen
- Derrick Michael Reid
- Jack Robinson, Jr.
- Rhett Smith
- Joy Waymire
- Marc Allan Feldman
Results
| North Carolina Libertarian presidential primary, March 15, 2016[7] | ||
|---|---|---|
| Candidate | Votes | Percentage |
| Gary Johnson | 2,414 | 41.48% |
| No Preference | 2,067 | 35.52% |
| John David Hale | 329 | 5.65% |
| Joy Waymire | 268 | 4.61% |
| Austin Petersen | 189 | 3.25% |
| Darryl Perry | 118 | 2.03% |
| Steve Kerbel | 109 | 1.87% |
| Derrick Michael Reid | 74 | 1.27% |
| Cecil Ince | 72 | 1% |
| Jack Robinson, Jr. | 70 | 1.20% |
| Marc Allan Feldman | 66 | 1.13% |
| Rhett Smith | 43 | 0.74% |
| Total | 5,739 | 100% |
General election
Polling
Candidates
In addition to Clinton, Johnson and Trump, Green Party nominee Jill Stein was granted write-in status by the North Carolina State Board of Elections, the only write-in candidate to qualify.[8][9]
Results
| Candidate | Popular vote | Percentage |
|---|---|---|
| Donald Trump | 2,362,631 | 49.83% |
| Hillary Clinton | 2,189,316 | 46.17% |
| Gary Johnson | 130,126 | 2.74% |
| Write-in | 47,386 | 1.00% |
| Jill Stein (write-in) | 12,105 | 0.26% |
| Total | 4,741,564 | 100.00% |
| Source: North Carolina State Board of Elections The Green Papers | ||
By county
| County[10] | Clinton percentage | Clinton Votes | Trump percentage | Trump Votes | Johnson percentage | Johnson Votes | Write-in percentage | Write-in Votes | Stein percentage | Stein Votes | Totals |
|---|---|---|---|---|---|---|---|---|---|---|---|
| Alamance | 41.92% | 29,818 | 54.55% | 38,802 | 2.52% | 1,795 | 0.70% | 496 | 0.30% | 216 | 71,127 |
| Alexander | 20.64% | 3,756 | 76.01% | 13,833 | 2.39% | 435 | 0.83% | 151 | 0.13% | 23 | 18,198 |
| Alleghany | 24.57% | 1,306 | 71.76% | 3,814 | 2.43% | 129 | 1.24% | 66 | 0.00% | 0 | 5,315 |
| Anson | 55.56% | 5,859 | 42.73% | 4,506 | 1.22% | 129 | 0.46% | 48 | 0.03% | 3 | 10,545 |
| Ashe | 26.07% | 3,500 | 70.12% | 9,413 | 2.47% | 332 | 1.34% | 180 | 0.00% | 0 | 13,425 |
| Avery | 20.48% | 1,689 | 76.35% | 6,298 | 2.01% | 166 | 0.88% | 73 | 0.28% | 23 | 8,249 |
| Beaufort | 36.61% | 8,764 | 60.75% | 14,543 | 1.78% | 426 | 0.75% | 180 | 0.10% | 25 | 23,936 |
| Bertie | 61.82% | 5,778 | 36.97% | 3,456 | 0.75% | 70 | 0.43% | 40 | 0.03% | 3 | 9,347 |
| Bladen | 44.38% | 7,021 | 53.80% | 8,511 | 1.33% | 211 | 0.48% | 76 | 0.00% | 0 | 15,819 |
| Brunswick | 34.06% | 23,282 | 62.50% | 42,717 | 2.51% | 1,717 | 0.78% | 536 | 0.14% | 96 | 68,348 |
| Buncombe | 54.30% | 75,421 | 40.10% | 55,694 | 3.08% | 4,284 | 1.41% | 1,958 | 1.10% | 1,534 | 138,891 |
| Burke | 28.91% | 11,251 | 67.42% | 26,238 | 2.54% | 988 | 0.83% | 324 | 0.31% | 119 | 38,920 |
| Cabarrus | 38.08% | 35,510 | 57.69% | 53,789 | 2.99% | 2,784 | 1.04% | 972 | 0.20% | 190 | 93,245 |
| Caldwell | 23.20% | 8,425 | 73.30% | 26,621 | 2.34% | 849 | 0.83% | 302 | 0.34% | 123 | 36,320 |
| Camden | 25.45% | 1,274 | 70.83% | 3,546 | 2.98% | 149 | 0.58% | 29 | 0.16% | 8 | 5,006 |
| Carteret | 26.31% | 9,939 | 70.32% | 26,569 | 2.42% | 913 | 0.74% | 278 | 0.22% | 82 | 37,781 |
| Caswell | 43.28% | 4,792 | 54.44% | 6,027 | 1.93% | 214 | 0.26% | 29 | 0.08% | 9 | 11,071 |
| Catawba | 29.32% | 21,216 | 66.79% | 48,324 | 2.73% | 1,973 | 0.95% | 685 | 0.21% | 153 | 72,351 |
| Chatham | 52.86% | 21,065 | 42.92% | 17,105 | 2.84% | 1,130 | 1.03% | 412 | 0.34% | 137 | 39,849 |
| Cherokee | 20.17% | 2,860 | 76.47% | 10,844 | 2.44% | 346 | 0.69% | 98 | 0.23% | 33 | 14,181 |
| Chowan | 41.39% | 2,992 | 55.53% | 4,014 | 2.24% | 162 | 0.68% | 49 | 0.15% | 11 | 7,228 |
| Clay | 22.75% | 1,367 | 73.83% | 4,437 | 2.38% | 143 | 0.90% | 54 | 0.15% | 9 | 6,010 |
| Cleveland | 33.50% | 14,961 | 63.75% | 28,474 | 1.90% | 850 | 0.68% | 305 | 0.17% | 75 | 44,665 |
| Columbus | 38.18% | 9,053 | 60.15% | 14,264 | 1.29% | 305 | 0.38% | 91 | 0.00% | 0 | 23,713 |
| Craven | 37.52% | 17,629 | 58.99% | 27,722 | 2.57% | 1,210 | 0.81% | 380 | 0.11% | 50 | 46,991 |
| Cumberland | 56.16% | 71,605 | 40.21% | 51,265 | 2.65% | 3,373 | 0.85% | 1,084 | 0.14% | 179 | 127,506 |
| Currituck | 22.99% | 2,913 | 72.33% | 9,163 | 3.80% | 482 | 0.66% | 84 | 0.21% | 27 | 12,669 |
| Dare | 36.81% | 7,323 | 58.43% | 11,626 | 3.47% | 690 | 1.03% | 205 | 0.26% | 52 | 19,896 |
| Davidson | 24.19% | 18,102 | 72.56% | 54,304 | 2.48% | 1,858 | 0.65% | 484 | 0.12% | 87 | 74,835 |
| Davie | 24.22% | 5,270 | 71.71% | 15,602 | 2.90% | 631 | 0.95% | 206 | 0.22% | 47 | 21,756 |
| Duplin | 39.72% | 8,283 | 58.58% | 12,217 | 1.25% | 260 | 0.41% | 85 | 0.05% | 11 | 20,845 |
| Durham | 77.67% | 121,166 | 18.15% | 28,314 | 2.56% | 3,995 | 1.28% | 1,996 | 0.34% | 535 | 156,006 |
| Edgecombe | 65.19% | 16,224 | 33.20% | 8,261 | 1.14% | 284 | 0.43% | 106 | 0.04% | 11 | 24,886 |
| Forsyth | 52.98% | 94,185 | 42.61% | 75,751 | 3.01% | 5,358 | 1.40% | 2,492 | 0.00% | 0 | 177,786 |
| Franklin | 42.39% | 12,874 | 53.90% | 16,368 | 2.56% | 777 | 0.97% | 296 | 0.17% | 53 | 30,368 |
| Gaston | 32.33% | 31,177 | 64.09% | 61,798 | 2.54% | 2,445 | 0.91% | 873 | 0.14% | 138 | 96,431 |
| Gates | 44.23% | 2,385 | 53.30% | 2,874 | 2.00% | 108 | 0.46% | 25 | 0.00% | 0 | 5,392 |
| Graham | 18.39% | 739 | 78.82% | 3,167 | 1.77% | 71 | 1.02% | 41 | 0.00% | 0 | 4,018 |
| Granville | 47.19% | 12,909 | 49.69% | 13,591 | 2.18% | 596 | 0.79% | 215 | 0.15% | 42 | 27,353 |
| Greene | 44.53% | 3,605 | 54.03% | 4,374 | 1.05% | 85 | 0.33% | 27 | 0.05% | 4 | 8,095 |
| Guilford | 57.98% | 149,248 | 38.10% | 98,062 | 2.62% | 6,754 | 1.04% | 2,667 | 0.26% | 674 | 257,405 |
| Halifax | 62.57% | 15,748 | 35.88% | 9,031 | 1.15% | 290 | 0.39% | 98 | 0.00% | 0 | 25,167 |
| Harnett | 36.33% | 16,737 | 59.95% | 27,614 | 2.72% | 1,252 | 0.84% | 389 | 0.16% | 73 | 46,065 |
| Haywood | 34.08% | 10,473 | 61.60% | 18,929 | 2.95% | 905 | 0.99% | 303 | 0.38% | 117 | 30,727 |
| Henderson | 34.08% | 19,827 | 61.55% | 35,807 | 2.80% | 1,626 | 1.18% | 687 | 0.39% | 227 | 58,174 |
| Hertford | 67.84% | 6,910 | 30.42% | 3,099 | 1.31% | 133 | 0.43% | 44 | 0.00% | 0 | 10,186 |
| Hoke | 53.35% | 9,725 | 42.57% | 7,759 | 3.17% | 577 | 0.77% | 140 | 0.15% | 27 | 18,184 |
| Hyde | 41.88% | 965 | 55.90% | 1,288 | 1.82% | 42 | 0.35% | 8 | 0.04% | 1 | 2,304 |
| Iredell | 29.96% | 24,734 | 66.31% | 54,754 | 2.65% | 2,185 | 0.91% | 754 | 0.17% | 140 | 82,567 |
| Jackson | 41.15% | 7,564 | 52.80% | 9,706 | 3.99% | 734 | 1.46% | 268 | 0.60% | 110 | 18,382 |
| Johnston | 33.17% | 28,362 | 63.59% | 54,372 | 2.74% | 2,347 | 0.37% | 314 | 0.13% | 112 | 85,507 |
| Jones | 40.21% | 2,065 | 57.92% | 2,974 | 1.15% | 59 | 0.72% | 37 | 0.00% | 0 | 5,135 |
| Lee | 41.74% | 10,469 | 54.66% | 13,712 | 2.73% | 684 | 0.76% | 191 | 0.11% | 28 | 25,084 |
| Lenoir | 46.45% | 12,091 | 51.41% | 13,381 | 1.52% | 395 | 0.62% | 162 | 0.00% | 0 | 26,029 |
| Lincoln | 24.73% | 9,897 | 71.97% | 28,806 | 2.43% | 971 | 0.76% | 305 | 0.11% | 44 | 40,023 |
| Macon | 27.50% | 4,876 | 68.38% | 12,127 | 2.63% | 467 | 1.29% | 228 | 0.20% | 36 | 17,734 |
| Madison | 34.84% | 3,926 | 60.19% | 6,783 | 2.98% | 336 | 0.91% | 103 | 1.07% | 121 | 11,269 |
| Martin | 48.86% | 5,846 | 49.29% | 5,897 | 1.38% | 165 | 0.39% | 47 | 0.08% | 9 | 11,964 |
| McDowell | 23.48% | 4,667 | 73.30% | 14,568 | 1.99% | 396 | 1.15% | 229 | 0.08% | 15 | 19,875 |
| Mecklenburg | 62.29% | 294,562 | 32.89% | 155,518 | 3.28% | 15,488 | 1.26% | 5,937 | 0.29% | 1,352 | 472,857 |
| Mitchell | 19.71% | 1,596 | 77.59% | 6,282 | 1.70% | 138 | 0.69% | 56 | 0.30% | 24 | 8,096 |
| Montgomery | 35.96% | 4,150 | 61.79% | 7,130 | 1.76% | 203 | 0.44% | 51 | 0.05% | 6 | 11,540 |
| Moore | 33.54% | 16,328 | 62.62% | 30,487 | 2.78% | 1,354 | 0.96% | 468 | 0.10% | 50 | 48,687 |
| Nash | 48.75% | 23,235 | 48.92% | 23,318 | 1.57% | 750 | 0.63% | 301 | 0.13% | 60 | 47,664 |
| New Hanover | 45.56% | 50,975 | 49.46% | 55,340 | 3.53% | 3,949 | 1.06% | 1,184 | 0.40% | 449 | 111,897 |
| Northampton | 62.39% | 6,144 | 36.37% | 3,582 | 0.94% | 93 | 0.29% | 29 | 0.00% | 0 | 9,848 |
| Onslow | 30.65% | 17,514 | 64.97% | 37,122 | 3.37% | 1,926 | 0.84% | 481 | 0.16% | 92 | 57,135 |
| Orange | 72.78% | 59,923 | 22.54% | 18,557 | 2.92% | 2,404 | 1.21% | 997 | 0.56% | 459 | 82,340 |
| Pamlico | 35.63% | 2,448 | 61.98% | 4,258 | 1.80% | 124 | 0.44% | 30 | 0.15% | 10 | 6,870 |
| Pasquotank | 49.54% | 8,615 | 47.04% | 8,180 | 2.54% | 442 | 0.70% | 122 | 0.18% | 32 | 17,391 |
| Pender | 33.54% | 9,354 | 63.26% | 17,639 | 2.45% | 683 | 0.56% | 157 | 0.19% | 52 | 27,885 |
| Perquimans | 34.57% | 2,319 | 62.27% | 4,177 | 2.42% | 162 | 0.64% | 43 | 0.10% | 7 | 6,708 |
| Person | 39.93% | 7,832 | 57.03% | 11,185 | 2.14% | 419 | 0.72% | 142 | 0.18% | 36 | 19,614 |
| Pitt | 51.94% | 41,824 | 44.32% | 35,691 | 2.68% | 2,162 | 0.84% | 680 | 0.21% | 170 | 80,527 |
| Polk | 34.16% | 3,735 | 61.90% | 6,768 | 2.49% | 272 | 0.98% | 107 | 0.48% | 52 | 10,934 |
| Randolph | 20.43% | 13,194 | 76.55% | 49,430 | 2.17% | 1,403 | 0.69% | 446 | 0.16% | 102 | 64,575 |
| Richmond | 43.98% | 8,501 | 53.72% | 10,383 | 1.72% | 333 | 0.45% | 87 | 0.12% | 24 | 19,328 |
| Robeson | 46.54% | 19,016 | 50.82% | 20,762 | 1.97% | 803 | 0.62% | 252 | 0.06% | 25 | 40,858 |
| Rockingham | 33.65% | 14,228 | 63.46% | 26,830 | 2.06% | 871 | 0.70% | 294 | 0.13% | 55 | 42,278 |
| Rowan | 30.14% | 19,400 | 66.51% | 42,810 | 2.36% | 1,517 | 0.88% | 564 | 0.12% | 78 | 64,369 |
| Rutherford | 24.80% | 7,515 | 72.16% | 21,869 | 2.06% | 624 | 0.86% | 261 | 0.13% | 39 | 30,308 |
| Sampson | 40.68% | 10,547 | 57.23% | 14,838 | 1.52% | 393 | 0.58% | 150 | 0.00% | 0 | 25,928 |
| Scotland | 52.55% | 7,319 | 44.92% | 6,256 | 1.82% | 254 | 0.52% | 73 | 0.19% | 26 | 13,928 |
| Stanly | 23.71% | 7,094 | 73.42% | 21,964 | 2.22% | 664 | 0.56% | 169 | 0.09% | 26 | 29,917 |
| Stokes | 20.69% | 4,665 | 75.90% | 17,116 | 2.53% | 571 | 0.77% | 173 | 0.11% | 25 | 22,550 |
| Surry | 23.26% | 9,005 | 73.52% | 23,671 | 2.30% | 739 | 0.78% | 250 | 0.15% | 48 | 32,196 |
| Swain | 35.86% | 2,196 | 58.24% | 3,566 | 3.92% | 240 | 1.50% | 92 | 0.47% | 27 | 6,123 |
| Transylvania | 36.70% | 6,558 | 58.87% | 10,520 | 2.74% | 489 | 1.23% | 220 | 0.46% | 82 | 17,869 |
| Tyrrell | 41.40% | 720 | 56.07% | 975 | 1.61% | 28 | 0.63% | 11 | 0.29% | 5 | 1,739 |
| Union | 32.48% | 34,335 | 63.10% | 66,705 | 3.15% | 3,327 | 1.11% | 1,176 | 0.15% | 163 | 105,706 |
| Vance | 61.22% | 12,229 | 36.70% | 7,332 | 1.47% | 294 | 0.49% | 97 | 0.13% | 25 | 19,977 |
| Wake | 57.38% | 302,569 | 37.16% | 195,984 | 3.69% | 19,445 | 1.44% | 7,600 | 0.33% | 1,739 | 527,337 |
| Warren | 65.17% | 6,419 | 32.64% | 3,215 | 1.49% | 147 | 0.70% | 69 | 0.00% | 0 | 9,850 |
| Washington | 56.93% | 3,509 | 41.60% | 2,564 | 1.05% | 65 | 0.41% | 25 | 0.02% | 1 | 6,164 |
| Watauga | 47.15% | 14,138 | 45.68% | 13,697 | 4.46% | 1,336 | 1.80% | 539 | 0.92% | 275 | 29,985 |
| Wayne | 42.95% | 21,769 | 54.33% | 27,540 | 1.90% | 963 | 0.76% | 383 | 0.07% | 33 | 50,688 |
| Wilkes | 21.21% | 6,638 | 75.89% | 23,752 | 2.07% | 647 | 0.73% | 228 | 0.10% | 31 | 31,296 |
| Wilson | 51.56% | 19,663 | 45.97% | 17,531 | 1.75% | 667 | 0.67% | 256 | 0.05% | 18 | 38,135 |
| Yadkin | 17.93% | 3,160 | 78.76% | 13,880 | 2.26% | 398 | 0.86% | 152 | 0.19% | 34 | 17,624 |
| Yancey | 32.09% | 3,196 | 64.11% | 6,385 | 2.62% | 261 | 0.77% | 77 | 0.41% | 41 | 9,960 |
| Totals | 46.17% | 2,188,201 | 49.84% | 2,361,942 | 2.75% | 130,099 | 1.00% | 47,438 | 0.25% | 11,612 | 4,739,292 |
By congressional district
Trump won 10 of 13 congressional districts.[11]
| District | Trump | Clinton | Representative |
|---|---|---|---|
| 1st | 30% | 67% | G.K. Butterfield |
| 2nd | 54% | 42% | Renee Ellmers |
| George Holding | |||
| 3rd | 60% | 36% | Walter B. Jones |
| 4th | 27% | 68% | David Price |
| 5th | 57% | 39% | Virginia Foxx |
| 6th | 56% | 41% | Mark Walker |
| 7th | 57% | 39% | David Rouzer |
| 8th | 56% | 41% | Richard Hudson |
| 9th | 54% | 42% | Robert Pittenger |
| 10th | 60% | 36% | Patrick T. McHenry |
| 11th | 62% | 33% | Mark Meadows |
| 12th | 28% | 68% | Alma Adams |
| 13th | 53% | 44% | Ted Budd |
Counties that swung from Democratic to Republican
- Bladen (largest town: Elizabethtown)
- Gates (largest town: Gatesville)
- Granville (largest city: Oxford)
- Martin (largest town: Williamston)
- Nash (largest city: Rocky Mount)
- Richmond (largest city: Rockingham)
- Robeson (largest city: Lumberton)
Counties that swung from Republican to Democratic
Analysis
Predictions
The following were final 2016 predictions from various organizations for North Carolina as of Election Day.
- Los Angeles Times: Leans Clinton[12]
- CNN: Tossup[13]
- Sabato's Crystal Ball: Leans Clinton[14]
- NBC: Tossup[15]
- Electoral-vote.com: Leans Clinton[16]
- RealClearPolitics: Tossup[17]
- Fox News: Tossup[18]
- ABC: Tossup[19]
Prior to the 2016 election, North Carolina had been a Republican stronghold since 1968 with the state voting Democratic only once between then and 2008. In 2008, North Carolina voted Democratic for only the second time in 40 years. However, the state returned to the Republicans in 2012 when the party's nominee, Mitt Romney, carried the state. Throughout the 2016 campaign, North Carolina was considered by most a tossup state, the outcome going into election night was heavily debated.
Despite winning the state, Trump, in someways, under-performed in comparison to Romney in 2012. Romney won a majority of the vote in 2012 with 50.4% while Trump only managed a plurality of 49.8%. Similarly, Clinton also under-performed in comparison to Obama, with Clinton winning only 46.2% in comparison to Obama's 48.35%. This situation was the result of the spike in votes for third party candidates in the state as 4% of North Carolinians voted for a candidate other than the Democratic and Republican nominees in 2016 as opposed to just 1.26% in 2012.
An increase in turnout in North Carolina allowed both Trump and Clinton to out-perform Romney and Obama in terms of the total votes each candidate received. In 2016 Trump won around 92,000 more votes than Romney did in 2012 while Clinton won around 10,000 more than Obama. Furthermore, Trump also outperformed Romney by winning North Carolina by a greater margin than Romney was able to as Trump won the state over Clinton by 3.6% compared to the 2% margin Romney won over Obama.
Trump's win in North Carolina marked the 9th time the state has voted Republican in the last 10 elections and, therefore, the state continues to leans more Republican at the presidential level. However, the Democratic victory in the concurrent gubernatorial election, changing demographics and very close margins, suggest that the Republican advantage in the state is waning and that it will remain a "battleground state".
See also
References
- 1 2 3 Binker, Mark. "NC approves 27 candidates for presidential primary ballots". WRAL.com. Retrieved 2016-11-13.
- 1 2 3
- 1 2 Burns, Matthew. "WRAL News poll: Trump, Clinton poised to win NC". WRAL.com. Retrieved 2016-11-13.
- ↑ "NC SBE Election Contest Details". Er.ncsbe.gov. Retrieved 2016-11-13.
- ↑ "NC SBE Election Contest Details". Er.ncsbe.gov. Retrieved 2016-11-13.
- ↑ "Live results from the North Carolina primary". graphics.latimes.com. Retrieved 2016-04-26.
- ↑ "NC SBE Contest Results". North Carolina State Board of Elections. Government of North Carolina. 16 March 2015. Retrieved 16 March 2016.
- ↑ News & Observer
- ↑ WFMY-TV
- ↑ "North Carolina State Board of Elections". Retrieved November 14, 2012.
- ↑ http://www.swingstateproject.com/diary/4161/
- ↑ "Our final map has Clinton winning with 352 electoral votes. Compare your picks with ours". Los Angeles Times. 2016-11-06. Retrieved 2016-11-13.
- ↑ "Road to 270: CNN's general election map - CNNPolitics.com". Cnn.com. 2016-11-08. Retrieved 2016-11-13.
- ↑ "Larry J. Sabato's Crystal Ball » 2016 President". Centerforpolitics.org. 2016-11-07. Retrieved 2016-11-13.
- ↑ Todd, Chuck. "NBC's Final Battleground Map Shows Clinton With a Significant Lead". NBC News. Retrieved 2016-11-13.
- ↑ "ElectoralVote". ElectoralVote. 2000-12-31. Retrieved 2016-11-13.
- ↑ "2016 Election Maps - Battle for White House". RealClearPolitics. Retrieved 2016-11-13.
- ↑ "Electoral Scorecard: Map shifts again in Trump's favor, as Clinton holds edge". Fox News. 2016-11-07. Retrieved 2016-11-13.
- ↑ "The Final 15: The Latest Polls in the Swing States That Will Decide the Election". Abcnews.go.com. 2016-11-07. Retrieved 2016-11-13.
External links
- North Carolina Bipartisan State Board of Elections and Ethics Enforcement
- North Carolina Democratic Party
- North Carolina Republican Party
- North Carolina Libertarian Party
- North Carolina Green Party
- RNC 2016 Republican Nominating Process
- Green papers for 2016 primaries, caucuses, and conventions
- 2016 Presidential primaries, ElectionProjection.com