Carroll County, Illinois
| Carroll County, Illinois | |
|---|---|
 | |
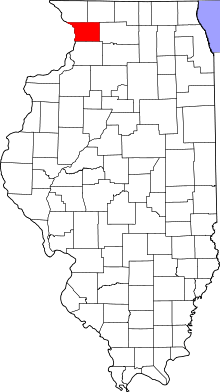 Location in the U.S. state of Illinois | |
 Illinois's location in the U.S. | |
| Founded | 1839 |
| Named for | Charles Carroll |
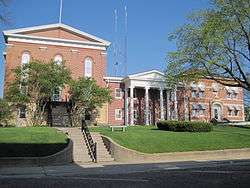
| Seat | Mount Carroll |
| Largest city | Savanna |
| Area | |
| • Total | 466 sq mi (1,207 km2) |
| • Land | 445 sq mi (1,153 km2) |
| • Water | 22 sq mi (57 km2), 4.6% |
| Population | |
| • (2010) | 15,387 |
| • Density | 35/sq mi (14/km2) |
| Congressional district | 17th |
| Time zone | Central: UTC−6/−5 |
| Website |
www |
Carroll County is a county located in the U.S. state of Illinois. As of the 2010 census, the population was 15,387. [1] Its county seat is Mount Carroll.[2]
History
Carroll County was formed in 1839 out of Jo Daviess County. The county is named for Charles Carroll who signed the Declaration of Independence.[3] Carroll, who died in 1832, was the last signer to die.
 Carroll County at the time of its creation in 1839
Geography
According to the U.S. Census Bureau, the county has a total area of 466 square miles (1,210 km2), of which 445 square miles (1,150 km2) is land and 22 square miles (57 km2) (4.6%) is water.[4] The Mississippi Palisades State Park is in this county, just north of the city of Savanna. The Savanna Army Depot is located partly in this county.
Adjacent counties
- Stephenson County - northeast
- Ogle County - east
- Whiteside County - south
- Clinton County, Iowa - southwest
- Jackson County, Iowa - west
- Jo Daviess County - northwest
National protected area
Major highways
Climate and weather
| Mount Carroll, Illinois | ||||||||||||||||||||||||||||||||||||||||||||||||||||||||||||
|---|---|---|---|---|---|---|---|---|---|---|---|---|---|---|---|---|---|---|---|---|---|---|---|---|---|---|---|---|---|---|---|---|---|---|---|---|---|---|---|---|---|---|---|---|---|---|---|---|---|---|---|---|---|---|---|---|---|---|---|---|
| Climate chart (explanation) | ||||||||||||||||||||||||||||||||||||||||||||||||||||||||||||
| ||||||||||||||||||||||||||||||||||||||||||||||||||||||||||||
| ||||||||||||||||||||||||||||||||||||||||||||||||||||||||||||
In recent years, average temperatures in the county seat of Mount Carroll have ranged from a low of 7 °F (−14 °C) in January to a high of 85 °F (29 °C) in July, although a record low of −31 °F (−35 °C) was recorded in January 1910 and a record high of 108 °F (42 °C) was recorded in July 1936. Average monthly precipitation ranged from 1.43 inches (36 mm) in January to 4.77 inches (121 mm) in June.[5]
Demographics

| Historical population | |||
|---|---|---|---|
| Census | Pop. | %± | |
| 1840 | 1,023 | — | |
| 1850 | 4,586 | 348.3% | |
| 1860 | 11,733 | 155.8% | |
| 1870 | 16,705 | 42.4% | |
| 1880 | 16,976 | 1.6% | |
| 1890 | 18,320 | 7.9% | |
| 1900 | 18,963 | 3.5% | |
| 1910 | 18,035 | −4.9% | |
| 1920 | 19,345 | 7.3% | |
| 1930 | 18,433 | −4.7% | |
| 1940 | 17,987 | −2.4% | |
| 1950 | 18,976 | 5.5% | |
| 1960 | 19,507 | 2.8% | |
| 1970 | 19,276 | −1.2% | |
| 1980 | 18,779 | −2.6% | |
| 1990 | 16,805 | −10.5% | |
| 2000 | 16,674 | −0.8% | |
| 2010 | 15,387 | −7.7% | |
| Est. 2016 | 14,539 | [6] | −5.5% |
| U.S. Decennial Census[7] 1790-1960[8] 1900-1990[9] 1990-2000[10] 2010-2013[1] | |||
As of the 2010 United States Census, there were 15,387 people, 6,622 households, and 4,343 families residing in the county.[11] The population density was 34.6 inhabitants per square mile (13.4/km2). There were 8,437 housing units at an average density of 19.0 per square mile (7.3/km2).[4] The racial makeup of the county was 96.9% white, 0.8% black or African American, 0.3% Asian, 0.3% American Indian, 0.6% from other races, and 1.1% from two or more races. Those of Hispanic or Latino origin made up 2.8% of the population.[11] In terms of ancestry, 40.4% were German, 14.0% were Irish, 11.2% were English, and 10.6% were American.[12]
Of the 6,622 households, 26.3% had children under the age of 18 living with them, 53.1% were married couples living together, 8.2% had a female householder with no husband present, 34.4% were non-families, and 29.8% of all households were made up of individuals. The average household size was 2.29 and the average family size was 2.80. The median age was 46.5 years.[11]
The median income for a household in the county was $44,805 and the median income for a family was $55,341. Males had a median income of $42,421 versus $27,552 for females. The per capita income for the county was $25,914. About 7.8% of families and 11.7% of the population were below the poverty line, including 18.4% of those under age 18 and 5.8% of those age 65 or over.[13]
Education
- Chadwick-Milledgeville Community Unit School District 399
- Eastland Community Unit School District 308
- West Carroll Community Unit School District 314
Communities
Cities
Villages
Townships
Carroll County is divided into these twelve townships:
Notable people
- John Acker, Illinois state representative, was born on a farm near Savanna.[14]
- Willis J. Bailey, United States Representative from Kansas and the 16th Governor of Kansas[15]
- David J. Summerville, Wisconsin State Assemblyman[16]
Politics
| Year | Republican | Democratic | Third Parties |
|---|---|---|---|
| 2016 | 59.6% 4,434 | 32.9% 2,447 | 7.6% 564 |
| 2012 | 48.0% 3,555 | 49.5% 3,665 | 2.5% 186 |
| 2008 | 46.7% 3,596 | 51.5% 3,965 | 1.7% 132 |
| 2004 | 55.7% 4,534 | 43.5% 3,537 | 0.8% 64 |
| 2000 | 53.4% 3,835 | 43.4% 3,113 | 3.2% 229 |
| 1996 | 44.6% 3,029 | 43.0% 2,926 | 12.4% 844 |
| 1992 | 42.9% 3,297 | 37.2% 2,854 | 19.9% 1,528 |
| 1988 | 59.4% 4,464 | 39.8% 2,990 | 0.8% 58 |
| 1984 | 68.4% 5,237 | 31.3% 2,398 | 0.3% 23 |
| 1980 | 63.4% 5,084 | 26.9% 2,154 | 9.8% 785 |
| 1976 | 59.3% 5,059 | 39.6% 3,372 | 1.1% 95 |
| 1972 | 70.0% 6,041 | 29.8% 2,571 | 0.2% 19 |
| 1968 | 63.7% 5,275 | 30.9% 2,558 | 5.4% 449 |
| 1964 | 52.5% 4,487 | 47.5% 4,062 | |
| 1960 | 66.7% 6,282 | 32.9% 3,097 | 0.4% 39 |
| 1956 | 70.6% 6,503 | 29.2% 2,693 | 0.2% 15 |
| 1952 | 72.9% 6,978 | 27.0% 2,584 | 0.2% 14 |
| 1948 | 64.9% 5,318 | 34.3% 2,809 | 0.8% 62 |
| 1944 | 68.1% 6,101 | 31.7% 2,843 | 0.2% 18 |
| 1940 | 63.9% 6,398 | 35.9% 3,592 | 0.2% 23 |
| 1936 | 52.4% 4,886 | 46.8% 4,368 | 0.8% 74 |
| 1932 | 53.8% 4,571 | 44.9% 3,812 | 1.3% 112 |
| 1928 | 76.3% 6,197 | 23.1% 1,876 | 0.6% 45 |
| 1924 | 60.9% 4,559 | 8.1% 603 | 31.0% 2,320 |
| 1920 | 86.7% 5,194 | 10.1% 606 | 3.2% 194 |
| 1916 | 67.0% 4,496 | 29.5% 1,980 | 3.5% 234 |
| 1912 | 38.4% 1,577 | 26.7% 1,098 | 34.9% 1,436 |
| 1908 | 66.7% 2,875 | 26.2% 1,129 | 7.1% 306 |
| 1904 | 76.4% 3,128 | 16.9% 691 | 6.7% 273 |
| 1900 | 71.5% 3,425 | 26.4% 1,266 | 2.0% 97 |
| 1896 | 67.9% 3,314 | 30.3% 1,480 | 1.8% 86 |
| 1892 | 58.8% 2,456 | 34.6% 1,444 | 6.6% 277 |
As a part of Yankee-settled Northern Illinois, Carroll County became solidly Republican upon that party’s formation in the 1850s. Of all the counties won by inaugural Republican Party presidential nominee John Charles Frémont in 1856, Carroll County was to maintain the longest unbroken string of supporting the GOP in subsequent elections. It would give a plurality to every subsequent Republican Presidential nominee up to George W. Bush in 2004, beating by three elections the second longest run of Indiana’s Porter County which was to give a plurality to Bill Clinton in 1996.
In that 1996 election Bob Dole won Carroll County by only 1.51 percentage points – the smallest margin by a Republican to that point – and in 2008 Illinois native Barack Obama broke this last remaining GOP streak stretching back to Frémont by carrying the county by 4.80 percentage points. Obama was to repeat his win in 2012 by 1.49 percent, but a dramatic swing to Republican Donald Trump in 2016 saw him win by the largest margin since Ronald Reagan’s 1984 landslide.
See also
References
- 1 2 "State & County QuickFacts". United States Census Bureau. Archived from the original on July 8, 2011. Retrieved July 4, 2014.
- ↑ "Find a County". National Association of Counties. Archived from the original on 2011-05-31. Retrieved 2011-06-07.
- ↑ Gannett, Henry (1905). The Origin of Certain Place Names in the United States. Govt. Print. Off. p. 70.
- 1 2 "Population, Housing Units, Area, and Density: 2010 - County". United States Census Bureau. Retrieved 2015-07-11.
- 1 2 "Monthly Averages for Mount Carroll, Illinois". The Weather Channel. Archived from the original on 2012-10-23. Retrieved 2011-01-27.
- ↑ "Population and Housing Unit Estimates". Archived from the original on May 29, 2017. Retrieved June 9, 2017.
- ↑ "U.S. Decennial Census". United States Census Bureau. Archived from the original on May 12, 2015. Retrieved July 4, 2014.
- ↑ "Historical Census Browser". University of Virginia Library. Archived from the original on August 16, 2012. Retrieved July 4, 2014.
- ↑ "Population of Counties by Decennial Census: 1900 to 1990". United States Census Bureau. Archived from the original on April 24, 2014. Retrieved July 4, 2014.
- ↑ "Census 2000 PHC-T-4. Ranking Tables for Counties: 1990 and 2000" (PDF). United States Census Bureau. Archived (PDF) from the original on December 18, 2014. Retrieved July 4, 2014.
- 1 2 3 "DP-1 Profile of General Population and Housing Characteristics: 2010 Demographic Profile Data". United States Census Bureau. Retrieved 2015-07-11.
- ↑ "DP02 SELECTED SOCIAL CHARACTERISTICS IN THE UNITED STATES – 2006-2010 American Community Survey 5-Year Estimates". United States Census Bureau. Retrieved 2015-07-11.
- ↑ "DP03 SELECTED ECONOMIC CHARACTERISTICS – 2006-2010 American Community Survey 5-Year Estimates". United States Census Bureau. Retrieved 2015-07-11.
- ↑ 'Illinois Blue Book 1933-1934,' Biographical Sketch of John Acker, pg. 219
- ↑ "Kansas Governor Willis Joshua Bailey". National Governors Association. Archived from the original on January 17, 2012. Retrieved September 29, 2012.
- ↑ 'Wisconsin Blue Book 1923,' Biographical Sketch of David J. Summerville, pg. 636
- ↑ Leip, David. "Dave Leip's Atlas of U.S. Presidential Elections". uselectionatlas.org. Archived from the original on 2018-03-23.
External links
- Carroll County Government
- Visit Carroll County
- Village of Chadwick
- City of Lanark
- Village of Milledgeville
- City of Mt. Carroll
- City of Savanna
- Visit Savanna
- Village of Shannon
- Village of Thomson
- Visit Thomson
- United States Census Bureau 2007 TIGER/Line Shapefiles
- United States Board on Geographic Names (GNIS)
- United States National Atlas
Places adjacent to Carroll County, Illinois | ||||||||||
|---|---|---|---|---|---|---|---|---|---|---|
| ||||||||||
Municipalities and communities of Carroll County, Illinois, United States | ||
|---|---|---|
| Cities | ||
| Villages | ||
| Townships | ||
| Unincorporated communities | ||
| Ghost town | ||
| Footnotes | ‡This populated place also has portions in an adjacent county or counties | |
