Shelby County, Illinois
| Shelby County, Illinois | |
|---|---|
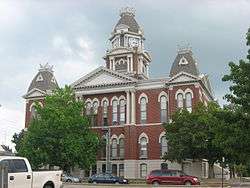 Shelby County Courthouse | |
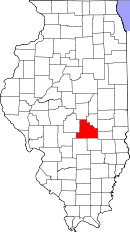 Location in the U.S. state of Illinois | |
 Illinois's location in the U.S. | |
| Founded | 1827 |
| Named for | Isaac Shelby |
| Seat | Shelbyville |
| Largest city | Shelbyville |
| Area | |
| • Total | 768 sq mi (1,989 km2) |
| • Land | 759 sq mi (1,966 km2) |
| • Water | 9.5 sq mi (25 km2), 1.2% |
| Population | |
| • (2010) | 22,363 |
| • Density | 29/sq mi (11/km2) |
| Congressional district | 15th |
| Time zone | Central: UTC−6/−5 |
| Website |
www |
Shelby County is a county located in the U.S. state of Illinois. According to the 2010 census, it had a population of 22,363.[1] Its county seat is Shelbyville.[2]
History
Shelby County was formed in 1827 out of Fayette County. It was named in honor of Isaac Shelby, Governor of Kentucky and participant in the American Revolutionary War.
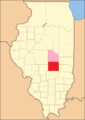 Shelby county from the time of its creation to 1829, including a large tract of unorganized territory temporarily attached to it, whose precise border was not defined.[3]
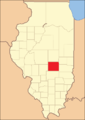 Shelby County between 1829 and 1839
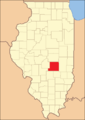 Shelby County between 1839 and 1843
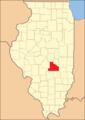 Shelby County in 1843, reduced to its present borders
Geography
According to the U.S. Census Bureau, the county has a total area of 768 square miles (1,990 km2), of which 759 square miles (1,970 km2) is land and 9.5 square miles (25 km2) (1.2%) is water.[4]
Climate and weather
| Shelbyville, Illinois | ||||||||||||||||||||||||||||||||||||||||||||||||||||||||||||
|---|---|---|---|---|---|---|---|---|---|---|---|---|---|---|---|---|---|---|---|---|---|---|---|---|---|---|---|---|---|---|---|---|---|---|---|---|---|---|---|---|---|---|---|---|---|---|---|---|---|---|---|---|---|---|---|---|---|---|---|---|
| Climate chart (explanation) | ||||||||||||||||||||||||||||||||||||||||||||||||||||||||||||
| ||||||||||||||||||||||||||||||||||||||||||||||||||||||||||||
| ||||||||||||||||||||||||||||||||||||||||||||||||||||||||||||
In recent years, average temperatures in the county seat of Shelbyville have ranged from a low of 19 °F (−7 °C) in January to a high of 87 °F (31 °C) in July, although a record low of −26 °F (−32 °C) was recorded in January 1915 and a record high of 111 °F (44 °C) was recorded in July 1936. Average monthly precipitation ranged from 1.89 inches (48 mm) in February to 4.05 inches (103 mm) in June.[5]
Major highways
Adjacent counties
- Macon County - north
- Moultrie County - northeast
- Coles County - east
- Cumberland County - east
- Effingham County - south
- Fayette County - south
- Montgomery County - southwest
- Christian County - west
Demographics
| Historical population | |||
|---|---|---|---|
| Census | Pop. | %± | |
| 1830 | 2,971,111 | — | |
| 1840 | 6,659 | −99.8% | |
| 1850 | 7,807 | 17.2% | |
| 1860 | 14,613 | 87.2% | |
| 1870 | 25,476 | 74.3% | |
| 1880 | 30,270 | 18.8% | |
| 1890 | 31,191 | 3.0% | |
| 1900 | 32,126 | 3.0% | |
| 1910 | 31,693 | −1.3% | |
| 1920 | 29,601 | −6.6% | |
| 1930 | 25,471 | −14.0% | |
| 1940 | 26,290 | 3.2% | |
| 1950 | 24,434 | −7.1% | |
| 1960 | 23,404 | −4.2% | |
| 1970 | 22,589 | −3.5% | |
| 1980 | 23,923 | 5.9% | |
| 1990 | 22,261 | −6.9% | |
| 2000 | 22,893 | 2.8% | |
| 2010 | 22,363 | −2.3% | |
| Est. 2016 | 21,717 | [6] | −2.9% |
| U.S. Decennial Census[7] 1790-1960[8] 1900-1990[9] 1990-2000[10] 2010-2013[1] | |||
As of the 2010 United States Census, there were 22,363 people, 9,216 households, and 6,376 families residing in the county.[11] The population density was 29.5 inhabitants per square mile (11.4/km2). There were 10,396 housing units at an average density of 13.7 per square mile (5.3/km2).[4] The racial makeup of the county was 98.6% white, 0.3% Asian, 0.2% American Indian, 0.2% black or African American, 0.2% from other races, and 0.6% from two or more races. Those of Hispanic or Latino origin made up 0.8% of the population.[11] In terms of ancestry, 25.5% were German, 9.9% were English, 9.8% were American, and 8.8% were Irish.[12]
Of the 9,216 households, 29.2% had children under the age of 18 living with them, 57.1% were married couples living together, 8.0% had a female householder with no husband present, 30.8% were non-families, and 27.1% of all households were made up of individuals. The average household size was 2.40 and the average family size was 2.90. The median age was 43.5 years.[11]
The median income for a household in the county was $44,627 and the median income for a family was $55,655. Males had a median income of $40,119 versus $27,860 for females. The per capita income for the county was $21,891. About 7.8% of families and 11.3% of the population were below the poverty line, including 16.7% of those under age 18 and 8.1% of those age 65 or over.[13]
Communities
Cities
Town
Villages
Census-designated place
Other unincorporated communities
- Clarksburg
- Dollville
- Duvall
- Fancher
- Henton
- Herborn
- Hinton
- Kingman
- Lakewood
- Middlesworth
- Mode
- Rennerville
- Yantisville
Townships
Shelby County is divided into these townships:
Politics
| Year | Republican | Democratic | Third Parties |
|---|---|---|---|
| 2016 | 74.5% 8,229 | 20.7% 2,288 | 4.8% 532 |
| 2012 | 65.6% 6,843 | 32.0% 3,342 | 2.4% 254 |
| 2008 | 58.7% 6,396 | 38.9% 4,245 | 2.4% 261 |
| 2004 | 63.9% 6,753 | 35.4% 3,744 | 0.8% 80 |
| 2000 | 57.6% 5,851 | 39.5% 4,018 | 2.9% 294 |
| 1996 | 43.1% 4,215 | 43.4% 4,249 | 13.5% 1,324 |
| 1992 | 32.5% 3,631 | 45.7% 5,101 | 21.9% 2,443 |
| 1988 | 53.3% 5,370 | 46.1% 4,650 | 0.6% 58 |
| 1984 | 59.4% 6,372 | 40.2% 4,317 | 0.4% 41 |
| 1980 | 59.1% 6,441 | 36.6% 3,988 | 4.3% 465 |
| 1976 | 45.5% 5,234 | 53.7% 6,172 | 0.8% 87 |
| 1972 | 62.1% 7,217 | 37.8% 4,389 | 0.2% 20 |
| 1968 | 49.3% 5,487 | 40.7% 4,528 | 10.1% 1,122 |
| 1964 | 37.7% 4,281 | 62.3% 7,088 | 0.0% 0 |
| 1960 | 54.5% 6,872 | 45.4% 5,720 | 0.1% 11 |
| 1956 | 56.9% 7,075 | 43.0% 5,337 | 0.1% 13 |
| 1952 | 57.7% 7,189 | 42.3% 5,268 | 0.1% 12 |
| 1948 | 47.9% 5,282 | 50.7% 5,589 | 1.4% 158 |
| 1944 | 50.7% 6,201 | 48.4% 5,919 | 1.0% 123 |
| 1940 | 47.7% 7,250 | 50.7% 7,704 | 1.6% 243 |
| 1936 | 40.8% 5,795 | 57.6% 8,186 | 1.6% 220 |
| 1932 | 35.9% 4,657 | 62.4% 8,093 | 1.7% 219 |
| 1928 | 62.6% 7,214 | 35.3% 4,071 | 2.1% 243 |
| 1924 | 48.1% 5,605 | 45.2% 5,265 | 6.7% 776 |
| 1920 | 53.9% 6,351 | 43.4% 5,113 | 2.7% 312 |
| 1916 | 42.6% 5,911 | 54.2% 7,515 | 3.2% 445 |
| 1912 | 20.8% 1,431 | 50.3% 3,467 | 28.9% 1,991 |
| 1908 | 42.3% 3,312 | 51.9% 4,065 | 5.8% 453 |
| 1904 | 46.5% 3,220 | 42.8% 2,962 | 10.7% 738 |
| 1900 | 41.4% 3,365 | 55.5% 4,514 | 3.1% 252 |
| 1896 | 38.8% 3,071 | 59.4% 4,709 | 1.8% 145 |
| 1892 | 32.5% 2,304 | 49.6% 3,523 | 17.9% 1,273 |
See also
References
- 1 2 "State & County QuickFacts". United States Census Bureau. Retrieved July 8, 2014.
- ↑ "Find a County". National Association of Counties. Retrieved 2011-06-07.
- ↑ White, Jesse. Origin and Evolution of Illinois Counties. State of Illinois, March 2010.
- 1 2 "Population, Housing Units, Area, and Density: 2010 - County". United States Census Bureau. Retrieved 2015-07-12.
- 1 2 "Monthly Averages for Shelbyville, Illinois". The Weather Channel. Retrieved 2011-01-27.
- ↑ "Population and Housing Unit Estimates". Retrieved June 9, 2017.
- ↑ "U.S. Decennial Census". United States Census Bureau. Retrieved July 8, 2014.
- ↑ "Historical Census Browser". University of Virginia Library. Retrieved July 8, 2014.
- ↑ "Population of Counties by Decennial Census: 1900 to 1990". United States Census Bureau. Retrieved July 8, 2014.
- ↑ "Census 2000 PHC-T-4. Ranking Tables for Counties: 1990 and 2000" (PDF). United States Census Bureau. Retrieved July 8, 2014.
- 1 2 3 "DP-1 Profile of General Population and Housing Characteristics: 2010 Demographic Profile Data". United States Census Bureau. Retrieved 2015-07-12.
- ↑ "DP02 SELECTED SOCIAL CHARACTERISTICS IN THE UNITED STATES – 2006-2010 American Community Survey 5-Year Estimates". United States Census Bureau. Retrieved 2015-07-12.
- ↑ "DP03 SELECTED ECONOMIC CHARACTERISTICS – 2006-2010 American Community Survey 5-Year Estimates". United States Census Bureau. Retrieved 2015-07-12.
- ↑ http://uselectionatlas.org/RESULTS
Places adjacent to Shelby County, Illinois | ||||||||||
|---|---|---|---|---|---|---|---|---|---|---|
| ||||||||||
Municipalities and communities of Shelby County, Illinois, United States | ||
|---|---|---|
| Cities | ||
| Towns | ||
| Villages | ||
| Townships | ||
| CDP | ||
| Other unincorporated communities |
| |
| Footnotes | ‡This populated place also has portions in an adjacent county or counties | |
