United States presidential election in West Virginia, 2016
|
| ||||||||||||||||||||||||||
| ||||||||||||||||||||||||||
| Turnout | 57.45%[1] | |||||||||||||||||||||||||
|---|---|---|---|---|---|---|---|---|---|---|---|---|---|---|---|---|---|---|---|---|---|---|---|---|---|---|
| ||||||||||||||||||||||||||
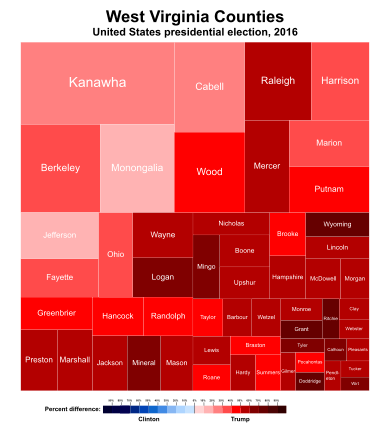
 County Results
Trump 50-60% 60-70% 70-80% 80-90%
| ||||||||||||||||||||||||||
| ||||||||||||||||||||||||||
.jpg)

| Elections in West Virginia | ||||||||||
|---|---|---|---|---|---|---|---|---|---|---|
 | ||||||||||
|
Federal elections
|
||||||||||
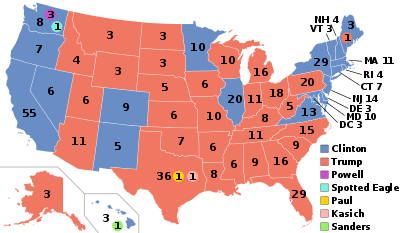
The 2016 United States presidential election in West Virginia was held on November 8, 2016, as part of the 2016 General Election in which all 50 states plus the District of Columbia participated. West Virginia voters chose electors to represent them in the Electoral College via a popular vote pitting the Republican Party's nominee, businessman Donald Trump, and running mate Indiana Governor Mike Pence against Democratic Party nominee, former Secretary of State Hillary Clinton and her running mate, Virginia Senator Tim Kaine.
On May 10, 2016, in the presidential primaries, West Virginia voters expressed their preferences for the Democratic, Republican, Green, and Libertarian parties' respective nominees for president. Registered members of each party only voted in their party's primary, while voters who were unaffiliated chose any one primary in which to vote.
Donald Trump easily won West Virginia, with 68.5% of the vote, giving him his largest share of the vote in any state. Hillary Clinton received just over a quarter of the vote, with 26.4%. Trump's performance in the state made it his second strongest state in the 2016 election after Wyoming[2].
West Virginia was also one of two states where Donald Trump won every county, the other being Oklahoma. Trump's 42.2% margin of victory is the largest of any presidential candidate from either party in the state's history, besting Abraham Lincoln's 36.4% margin of victory in 1864.
Primary elections
Democratic primary

Six candidates appeared on the Democratic presidential primary ballot:[3] (alphabetically)
- Hillary Clinton
- Rocky De La Fuente
- Paul T. Farrell Jr.
- Martin O'Malley (withdrawn)
- Keith Judd
- Bernie Sanders
| West Virginia Democratic primary, May 10, 2016 | |||||
|---|---|---|---|---|---|
| Candidate | Popular vote | Delegates | |||
| Count | Percentage | Pledged | Unpledged | Total | |
| Hillary Clinton | 86,914 | 35.84% | 11 | 8 | 19 |
| Bernie Sanders | 124,700 | 51.41% | 18 | 18 | |
| Paul T. Farrell Jr. | 21,694 | 8.94% | |||
| Keith Russell Judd | 4,460 | 1.84% | |||
| Martin O'Malley (withdrawn) | 3,796 | 1.57% | |||
| Rocky De La Fuente | 975 | 0.40% | |||
| Uncommitted | N/A | 0 | 0 | 0 | |
| Total | 242,539 | 100% | 29 | 8 | 37 |
| Source: The Green Papers, West Virginia Secretary of State | |||||
Republican primary
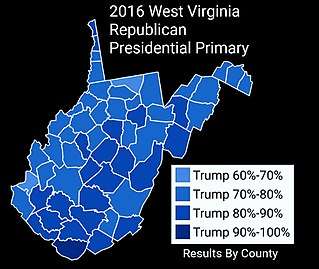
Eleven candidates appeared on the Republican presidential primary ballot:[3]
- Jeb Bush (withdrawn)
- Ben Carson (withdrawn)
- Chris Christie (withdrawn)
- Ted Cruz (withdrawn)
- Carly Fiorina (withdrawn)
- Mike Huckabee (withdrawn)
- John Kasich (withdrawn)
- Rand Paul (withdrawn)
- Marco Rubio (withdrawn)
- Donald Trump
| West Virginia Republican primary, May 10, 2016 | |||||
|---|---|---|---|---|---|
| Candidate | Votes | Percentage | Actual delegate count | ||
| Bound | Unbound | Total | |||
| 157,238 | 77.05% | 32 | 0 | 32 | |
| Ted Cruz (withdrawn) | 18,301 | 8.97% | 0 | 0 | 0 |
| John Kasich (withdrawn) | 13,721 | 6.72% | 1 | 0 | 1 |
| Ben Carson (withdrawn) | 4,421 | 2.17% | 0 | 0 | 0 |
| Marco Rubio (withdrawn) | 2,908 | 1.43% | 0 | 0 | 0 |
| Jeb Bush (withdrawn) | 2,305 | 1.13% | 0 | 0 | 0 |
| Rand Paul (withdrawn) | 1,798 | 0.88% | 0 | 0 | 0 |
| Mike Huckabee (withdrawn) | 1,780 | 0.87% | 0 | 0 | 0 |
| Chris Christie (withdrawn) | 727 | 0.36% | 0 | 0 | 0 |
| Carly Fiorina (withdrawn) | 659 | 0.32% | 0 | 0 | 0 |
| David Eames Hall | 203 | 0.10% | 0 | 0 | 0 |
| Uncommitted | 1 | 0 | 1 | ||
| Unprojected delegates: | 0 | 0 | 0 | ||
| Total: | 204,061 | 100.00% | 34 | 0 | 34 |
| Source: The Green Papers | |||||
Polling
Analysis
As expected, Republican nominee Donald Trump won West Virginia in a 42-point rout (the largest of any presidential candidate in the state's history) over Democratic nominee Hillary Clinton,[4] thanks to ardent support from coal industry workers in Appalachia. He thus captured all five electoral votes from the Mountain State. Trump had promised to bring back mining jobs in economically depressed areas of coal country, whereas his opponent had proposed investing millions into converting the region to a producer of green energy.[5][6] Democrats' championing of environmentalism is viewed as a threat in coal country, and Clinton faced a towering rejection from Mountain State voters. Clinton was also seen as being "haunted" by a comment she made within the state itself, in which in describing the transition to clean energy she stated "We’re going to put a lot of coal miners and coal companies out of business."[7]
West Virginia was once a solidly Democratic state; it voted Democratic in every election from 1932 to 1996, except for the Republican landslides of 1956, 1972, and 1984. However, in recent years it has drifted to becoming solidly Republican, and has stayed that way since it was won by George W. Bush in 2000. Barack Obama, for example, failed to win even a single county in 2012. West Virginia is one of the two states where Hillary Clinton did not win any counties, the other being Oklahoma, which last voted for a Democrat in 1964.[8]
General election
Statewide results
| Party | Candidate | Votes | % | ± | |
|---|---|---|---|---|---|
| Republican | Donald Trump | 489,371 | 68.50% | ||
| Democratic | Hillary Clinton | 188,794 | 26.43% | ||
| Libertarian | Gary Johnson | 23,004 | 3.22% | ||
| Green | Jill Stein | 8,075 | 1.13% | ||
| Constitution | Darrell Castle | 3,807 | 0.53% | ||
| Majority | 300,577 | 42.07% | |||
| Total votes | 714,423 | 100.00% | |||
| Republican win | |||||
By congressional district
Trump won all three congressional districts.[10]
| District | Trump | Clinton | Representative |
|---|---|---|---|
| 1st | 68% | 26% | David McKinley |
| 2nd | 66% | 29% | Alex Mooney |
| 3rd | 73% | 23% | Evan Jenkins |
By county
| County | Clinton% | Clinton# | Trump% | Trump# | Others% | Others# | Total |
|---|---|---|---|---|---|---|---|
| Barbour County | 20.19% | 1,222 | 74.78% | 4,527 | 5.04% | 305 | 6,054 |
| Berkeley County | 28.75% | 12,321 | 65.91% | 28,244 | 5.33% | 2,285 | 42,850 |
| Boone County | 20.61% | 1,790 | 74.90% | 6,504 | 4.48% | 389 | 8,683 |
| Braxton County | 25.95% | 1,321 | 69.49% | 3,537 | 4.56% | 232 | 5,090 |
| Brooke County | 26.71% | 2,568 | 68.92% | 6,625 | 4.37% | 420 | 9,613 |
| Cabell County | 34.60% | 11,447 | 60.00% | 19,850 | 5.40% | 1,788 | 33,085 |
| Calhoun County | 17.42% | 456 | 77.76% | 2,035 | 4.81% | 126 | 2,617 |
| Clay County | 19.11% | 568 | 77.39% | 2,300 | 3.50% | 104 | 2,972 |
| Doddridge County | 12.75% | 362 | 83.03% | 2,358 | 4.23% | 120 | 2,840 |
| Fayette County | 27.97% | 4,290 | 67.53% | 10,357 | 4.50% | 690 | 15,337 |
| Gilmer County | 21.43% | 545 | 74.56% | 1,896 | 4.01% | 102 | 2,543 |
| Grant County | 10.33% | 512 | 87.69% | 4,346 | 1.98% | 98 | 4,956 |
| Greenbrier County | 26.77% | 3,765 | 67.94% | 9,556 | 5.30% | 745 | 14,066 |
| Hampshire County | 18.36% | 1,580 | 77.74% | 6,692 | 3.90% | 336 | 8,608 |
| Hancock County | 25.68% | 3,262 | 70.14% | 8,909 | 4.18% | 531 | 12,702 |
| Hardy County | 20.47% | 1,155 | 75.74% | 4,274 | 3.79% | 214 | 5,643 |
| Harrison County | 27.52% | 7,694 | 67.06% | 18,750 | 5.42% | 1,516 | 27,960 |
| Jackson County | 21.85% | 2,663 | 74.01% | 9,020 | 4.14% | 504 | 12,187 |
| Jefferson County | 39.42% | 9,518 | 54.68% | 13,204 | 5.90% | 1,425 | 24,147 |
| Kanawha County | 37.34% | 28,263 | 57.93% | 43,850 | 4.73% | 3,577 | 75,690 |
| Lewis County | 19.44% | 1,347 | 76.13% | 5,274 | 4.43% | 307 | 6,928 |
| Lincoln County | 20.65% | 1,459 | 75.11% | 5,307 | 4.25% | 300 | 7,066 |
| Logan County | 16.93% | 2,092 | 80.08% | 9,897 | 2.99% | 370 | 12,359 |
| Marion County | 30.24% | 6,964 | 63.69% | 14,668 | 6.07% | 1,397 | 23,029 |
| Marshall County | 22.08% | 2,918 | 73.14% | 9,666 | 4.78% | 632 | 13,216 |
| Mason County | 20.43% | 2,081 | 75.14% | 7,654 | 4.43% | 451 | 10,186 |
| McDowell County | 23.18% | 1,438 | 74.63% | 4,629 | 2.19% | 136 | 6,203 |
| Mercer County | 20.47% | 4,704 | 75.73% | 17,404 | 3.80% | 874 | 22,982 |
| Mineral County | 17.73% | 2,050 | 78.43% | 9,070 | 3.84% | 444 | 11,564 |
| Mingo County | 14.41% | 1,370 | 83.19% | 7,911 | 2.41% | 229 | 9,510 |
| Monongalia County | 40.78% | 14,699 | 51.13% | 18,432 | 8.09% | 2,917 | 36,048 |
| Monroe County | 19.14% | 1,111 | 76.54% | 4,443 | 4.32% | 251 | 5,805 |
| Morgan County | 20.55% | 1,573 | 74.89% | 5,732 | 4.56% | 349 | 7,654 |
| Nicholas County | 19.39% | 1,840 | 76.40% | 7,251 | 4.21% | 400 | 9,491 |
| Ohio County | 30.62% | 5,493 | 62.10% | 11,139 | 7.28% | 1,306 | 17,938 |
| Pendleton County | 22.60% | 729 | 74.36% | 2,398 | 3.04% | 98 | 3,225 |
| Pleasants County | 19.71% | 621 | 74.86% | 2,358 | 5.43% | 171 | 3,150 |
| Pocahontas County | 25.45% | 928 | 68.46% | 2,496 | 6.09% | 222 | 3,646 |
| Preston County | 19.51% | 2,470 | 75.35% | 9,538 | 5.14% | 651 | 12,659 |
| Putnam County | 23.64% | 5,884 | 71.46% | 17,788 | 4.90% | 1,221 | 24,893 |
| Raleigh County | 21.75% | 6,443 | 74.44% | 22,048 | 3.81% | 1,127 | 29,618 |
| Randolph County | 25.15% | 2,735 | 70.15% | 7,629 | 4.71% | 512 | 10,876 |
| Ritchie County | 12.17% | 496 | 83.56% | 3,405 | 4.27% | 174 | 4,075 |
| Roane County | 23.29% | 1,222 | 72.06% | 3,781 | 4.65% | 244 | 5,247 |
| Summers County | 24.48% | 1,190 | 71.06% | 3,455 | 4.46% | 217 | 4,862 |
| Taylor County | 22.81% | 1,491 | 72.39% | 4,733 | 4.80% | 314 | 6,538 |
| Tucker County | 21.61% | 751 | 73.81% | 2,565 | 4.58% | 159 | 3,475 |
| Tyler County | 13.88% | 507 | 81.99% | 2,996 | 4.13% | 151 | 3,654 |
| Upshur County | 19.16% | 1,766 | 75.99% | 7,005 | 4.85% | 447 | 9,218 |
| Wayne County | 22.11% | 3,357 | 73.46% | 11,152 | 4.43% | 673 | 15,182 |
| Webster County | 18.67% | 556 | 77.30% | 2,302 | 4.03% | 120 | 2,978 |
| Wetzel County | 21.69% | 1,359 | 72.13% | 4,519 | 6.18% | 387 | 6,265 |
| Wirt County | 15.94% | 386 | 78.90% | 1,911 | 5.16% | 125 | 2,422 |
| Wood County | 23.59% | 8,400 | 71.41% | 25,434 | 5.0% | 1,781 | 35,615 |
| Wyoming County | 13.56% | 1,062 | 83.60% | 6,547 | 2.83% | 222 | 7,831 |
See also
References
- ↑ "2016 General Election Turnout". www.sos.wv.gov. Retrieved 2017-09-03.
- ↑ "2016 Presidential Election Statistics". Dave Leip’s Atlas of U.S. Presidential Elections. Retrieved 2018-03-05.
- 1 2 http://ballot-access.org/2016/02/02/west-virginia-presidential-primary-ballots-set/
- ↑ "West Virginia Election Results 2016". Retrieved 2016-11-12.
- ↑ "Deep in Virginia's craggy coal country, they saw Trump as their only hope". Washington Post. Retrieved 2016-11-12.
- ↑ Thomas, Zoe (2016-11-02). "Coal country West Virginia feels forgotten by politics". BBC News. Retrieved 2016-11-12.
- ↑ Strauss, Daniel (May 10, 2016). "Clinton haunted by coal country comment". Politico. Retrieved June 3, 2017.
- ↑ "West Virginia Election Results 2016 – The New York Times". Retrieved November 10, 2016.
- ↑ https://transition.fec.gov/pubrec/fe2016/2016presgeresults.pdf
- ↑ https://www.cookpolitical.com/introducing-2017-cook-political-report-partisan-voter-index