Johnson County, Illinois
| Johnson County, Illinois | |
|---|---|
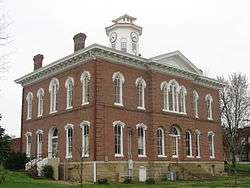 Johnson County Courthouse in Vienna | |
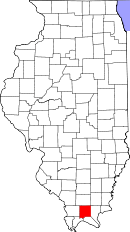 Location in the U.S. state of Illinois | |
 Illinois's location in the U.S. | |
| Founded | 1812 |
| Named for | Richard Mentor Johnson |
| Seat | Vienna |
| Largest city | Vienna |
| Area | |
| • Total | 349 sq mi (904 km2) |
| • Land | 344 sq mi (891 km2) |
| • Water | 4.9 sq mi (13 km2), 1.4% |
| Population | |
| • (2010) | 12,582 |
| • Density | 37/sq mi (14/km2) |
| Congressional district | 15th |
| Time zone | Central: UTC−6/−5 |
Johnson County is a county located in the U.S. state of Illinois. According to the 2010 census, it has a population of 12,582.[1] Its county seat is Vienna.[2] It is located in the southern portion of Illinois known locally as "Little Egypt".
History
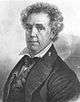
Johnson County was organized in 1812 out of Randolph County. It was named for Richard M. Johnson, who was then a U.S. Congressman from Kentucky.[3] In 1813, Johnson commanded a Kentucky regiment at the Battle of the Thames, after which he claimed to have killed Tecumseh in hand-to-hand combat. Johnson went on to be Vice President of the United States.
 Johnson County at the time of its creation to 1816
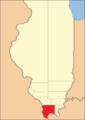 Johnson County between 1816 and 1818
 Johnson County between 1818 and 1843
 Johnson County in 1843, when it was reduced to its present size
Geography
According to the U.S. Census Bureau, the county has a total area of 349 square miles (900 km2), of which 344 square miles (890 km2) is land and 4.9 square miles (13 km2) (1.4%) is water.[4]
Climate and weather
| Vienna, Illinois | ||||||||||||||||||||||||||||||||||||||||||||||||||||||||||||
|---|---|---|---|---|---|---|---|---|---|---|---|---|---|---|---|---|---|---|---|---|---|---|---|---|---|---|---|---|---|---|---|---|---|---|---|---|---|---|---|---|---|---|---|---|---|---|---|---|---|---|---|---|---|---|---|---|---|---|---|---|
| Climate chart (explanation) | ||||||||||||||||||||||||||||||||||||||||||||||||||||||||||||
| ||||||||||||||||||||||||||||||||||||||||||||||||||||||||||||
| ||||||||||||||||||||||||||||||||||||||||||||||||||||||||||||
In recent years, average temperatures in the county seat of Vienna have ranged from a low of 25 °F (−4 °C) in January to a high of 90 °F (32 °C) in July, although a record low of −20 °F (−29 °C) was recorded in January 1977 and a record high of 103 °F (39 °C) was recorded in August 2007. Average monthly precipitation ranged from 3.16 inches (80 mm) in October to 5.16 inches (131 mm) in May.[5]
Major highways
Adjacent counties
- Williamson County - north
- Saline County - northeast
- Pope County - east
- Massac County - southeast
- Pulaski County - southwest
- Union County - west
National protected areas
Demographics
| Historical population | |||
|---|---|---|---|
| Census | Pop. | %± | |
| 1820 | 843 | — | |
| 1830 | 1,596 | 89.3% | |
| 1840 | 3,626 | 127.2% | |
| 1850 | 4,114 | 13.5% | |
| 1860 | 9,342 | 127.1% | |
| 1870 | 11,248 | 20.4% | |
| 1880 | 13,078 | 16.3% | |
| 1890 | 15,013 | 14.8% | |
| 1900 | 15,667 | 4.4% | |
| 1910 | 14,331 | −8.5% | |
| 1920 | 12,022 | −16.1% | |
| 1930 | 10,203 | −15.1% | |
| 1940 | 10,727 | 5.1% | |
| 1950 | 8,729 | −18.6% | |
| 1960 | 6,928 | −20.6% | |
| 1970 | 7,550 | 9.0% | |
| 1980 | 9,624 | 27.5% | |
| 1990 | 11,347 | 17.9% | |
| 2000 | 12,878 | 13.5% | |
| 2010 | 12,582 | −2.3% | |
| Est. 2017 | 12,900 | [7] | 2.5% |
| U.S. Decennial Census[8] 1790-1960[9] 1900-1990[10] 1990-2000[11] 2010-2013[1] | |||
2010
Whereas according to the 2010 U.S. Census Bureau:
- 89.0% White
- 8.0% Black
- 0.2% Native American
- 0.2% Asian
- 0.0% Native Hawaiian or Pacific Islander
- 1.0% Two or more races
- 1.6% Other races
- 3.0% Hispanic or Latino (of any race)
2000
As of the 2010 United States Census, there were 12,582 people, 4,584 households, and 3,270 families residing in the county.[12] The population density was 36.6 inhabitants per square mile (14.1/km2). There were 5,598 housing units at an average density of 16.3 per square mile (6.3/km2).[4] The racial makeup of the county was 89.0% white, 8.0% black or African American, 0.2% Asian, 0.2% American Indian, 1.6% from other races, and 1.0% from two or more races. Those of Hispanic or Latino origin made up 3.0% of the population.[12] In terms of ancestry, 17.6% were German, 11.5% were Irish, 10.9% were English, and 6.5% were American.[13]
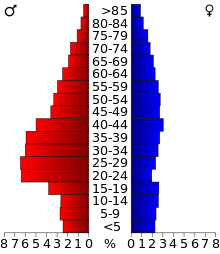
Of the 4,584 households, 28.8% had children under the age of 18 living with them, 59.2% were married couples living together, 8.3% had a female householder with no husband present, 28.7% were non-families, and 25.3% of all households were made up of individuals. The average household size was 2.41 and the average family size was 2.85. The median age was 42.2 years.[12]
The median income for a household in the county was $41,619 and the median income for a family was $47,423. Males had a median income of $48,047 versus $30,904 for females. The per capita income for the county was $16,402. About 11.1% of families and 13.6% of the population were below the poverty line, including 19.0% of those under age 18 and 10.7% of those age 65 or over.[14]
Communities
City
Villages
Unincorporated communities
- Boles
- Bloomfield
- Dixon Springs
- Eagle Point Bay
- Elvira
- Ganntown
- Grantsburg
- Lick Creek
- Mermet
- Ozark
- Parker City
- Pulleys Mill
- Reevesville
- Reynoldsburg
- Robbs
- Samoth
- Tunnel Hill
- Wartrace
Politics
| Year | Republican | Democratic | Third Parties |
|---|---|---|---|
| 2016 | 76.4% 4,649 | 18.8% 1,142 | 4.9% 298 |
| 2012 | 69.6% 3,963 | 27.6% 1,572 | 2.8% 159 |
| 2008 | 66.2% 3,912 | 31.6% 1,871 | 2.2% 131 |
| 2004 | 68.2% 3,997 | 30.9% 1,813 | 0.9% 55 |
| 2000 | 61.3% 3,285 | 36.0% 1,928 | 2.8% 149 |
| 1996 | 45.5% 2,241 | 40.8% 2,009 | 13.8% 680 |
| 1992 | 39.4% 2,124 | 42.7% 2,299 | 18.0% 968 |
| 1988 | 59.6% 2,797 | 39.9% 1,872 | 0.5% 23 |
| 1984 | 67.4% 3,424 | 32.4% 1,647 | 0.2% 12 |
| 1980 | 65.5% 3,201 | 32.5% 1,586 | 2.1% 101 |
| 1976 | 52.2% 2,417 | 47.2% 2,182 | 0.6% 29 |
| 1972 | 68.5% 2,826 | 31.4% 1,293 | 0.1% 4 |
| 1968 | 60.5% 2,406 | 28.8% 1,143 | 10.7% 426 |
| 1964 | 55.6% 2,217 | 44.4% 1,770 | |
| 1960 | 66.2% 2,778 | 33.7% 1,413 | 0.1% 6 |
| 1956 | 65.7% 2,973 | 34.2% 1,549 | 0.0% 2 |
| 1952 | 67.3% 3,327 | 32.6% 1,614 | 0.1% 6 |
| 1948 | 64.5% 2,778 | 35.0% 1,510 | 0.5% 21 |
| 1944 | 68.2% 3,298 | 31.5% 1,522 | 0.3% 13 |
| 1940 | 62.8% 3,827 | 37.0% 2,254 | 0.2% 13 |
| 1936 | 58.5% 3,537 | 41.3% 2,497 | 0.3% 16 |
| 1932 | 49.9% 2,424 | 49.1% 2,387 | 1.0% 50 |
| 1928 | 70.7% 2,892 | 28.4% 1,163 | 0.9% 36 |
| 1924 | 60.6% 2,468 | 34.6% 1,408 | 4.8% 197 |
| 1920 | 70.9% 2,972 | 27.1% 1,137 | 2.0% 82 |
| 1916 | 62.6% 3,273 | 34.8% 1,822 | 2.6% 135 |
| 1912 | 35.1% 1,025 | 32.6% 952 | 32.3% 946 |
| 1908 | 62.3% 1,913 | 34.3% 1,055 | 3.4% 104 |
| 1904 | 65.2% 2,164 | 29.5% 980 | 5.3% 177 |
| 1900 | 59.0% 1,940 | 38.7% 1,271 | 2.3% 76 |
| 1896 | 58.2% 2,027 | 41.0% 1,429 | 0.8% 28 |
| 1892 | 55.4% 1,716 | 27.6% 854 | 17.0% 527 |
In its early days Johnson County, being strongly Southern in its culture, was fiercely Democratic. In fact, in the 1860 Presidential election the county gave Illinois native and Northern Democrat Stephen A. Douglas a higher proportion of its votes than any other county in the United States.
However, during the Civil War, under the influence of Congressman John Logan, this region of dubious initial loyalty was to provide a number of Union soldiers rivalled on a per capita basis only by a few fiercely Unionist counties in Appalachia.[16][17]
This level of Union service has meant that despite its historic hostility towards Yankee culture, Johnson County has been powerfully Republican ever since the Civil War. Douglas in 1860 remains the last Democrat to win a majority of the county’s vote: the solitary Democratic victory since was by Bill Clinton in 1992 and was due to Ross Perot taking many votes from Republican incumbent George Bush senior. In 2016, as was typical of the rural Upland South, Hillary Clinton fared extremely badly in Johnson County: despite the long-time Republican traditions of the county, her vote percentage was the lowest by any Democrat in the county’s history, but was very typical of her performance in the region due to opposition to the Democratic Party’s liberal views on social issues like homosexuality.[18]
See also
References
- 1 2 "State & County QuickFacts". United States Census Bureau. Archived from the original on July 12, 2011. Retrieved July 6, 2014.
- ↑ "Find a County". National Association of Counties. Archived from the original on 2015-05-10. Retrieved 2011-06-07.
- ↑ Gannett, Henry (1905). The Origin of Certain Place Names in the United States. Govt. Print. Off. p. 169.
- 1 2 "Population, Housing Units, Area, and Density: 2010 - County". United States Census Bureau. Retrieved 2015-07-12.
- 1 2 "Monthly Averages for Vienna, Illinois". The Weather Channel. Retrieved 2011-01-27.
- ↑ State website Archived 2006-12-09 at the Wayback Machine.
- ↑ "Population and Housing Unit Estimates". Retrieved June 9, 2017.
- ↑ "U.S. Decennial Census". United States Census Bureau. Archived from the original on May 12, 2015. Retrieved July 6, 2014.
- ↑ "Historical Census Browser". University of Virginia Library. Retrieved July 6, 2014.
- ↑ "Population of Counties by Decennial Census: 1900 to 1990". United States Census Bureau. Retrieved July 6, 2014.
- ↑ "Census 2000 PHC-T-4. Ranking Tables for Counties: 1990 and 2000" (PDF). United States Census Bureau. Retrieved July 6, 2014.
- 1 2 3 "DP-1 Profile of General Population and Housing Characteristics: 2010 Demographic Profile Data". United States Census Bureau. Retrieved 2015-07-12.
- ↑ "DP02 SELECTED SOCIAL CHARACTERISTICS IN THE UNITED STATES – 2006-2010 American Community Survey 5-Year Estimates". United States Census Bureau. Retrieved 2015-07-12.
- ↑ "DP03 SELECTED ECONOMIC CHARACTERISTICS – 2006-2010 American Community Survey 5-Year Estimates". United States Census Bureau. Retrieved 2015-07-12.
- ↑ Leip, David. "Dave Leip's Atlas of U.S. Presidential Elections". uselectionatlas.org.
- ↑ Wells, Damon; Stephen Douglas: The Last Years, 1857–1861, p. 285 ISBN 0292776357
- ↑ Copeland, James E.; ‘Where Were the Kentucky Unionists and Secessionists’; The Register of the Kentucky Historical Society, volume 71, no. 4 (October, 1973), pp. 344-363
- ↑ Cohn, Nate; ‘Demographic Shift: Southern Whites’ Loyalty to G.O.P. Nearing That of Blacks to Democrats’, New York Times, April 24, 2014
Further reading
- P.T. Chapman, A History of Johnson County, Illinois. Herrin, IL: Press of the Herrin News, 1925.
Places adjacent to Johnson County, Illinois | ||||||||||
|---|---|---|---|---|---|---|---|---|---|---|
| ||||||||||
Municipalities and communities of Johnson County, Illinois, United States | ||
|---|---|---|
| Cities | ||
| Villages | ||
| Precincts |
| |
| Unincorporated communities | ||
| Footnotes | ‡This populated place also has portions in an adjacent county or counties | |

| Counties |  | |
|---|---|---|
| Mid-sized cities (25,000+) | ||
| Small Cities (10,000-25,000) | ||
| Small Cities (5,000-10,000) | ||
| Interstates | ||
| Airports/Military bases |
| |
| Universities | ||
| Colleges | ||
| Sports teams based in the Southern Illinois | ||