United States presidential election in New Jersey, 2016
|
|
|
| Turnout |
68%  |
|---|
|
|
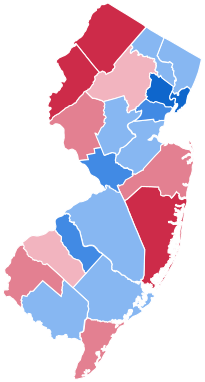 County Results
|
Clinton
50-60%
60-70%
70-80%
|
Trump
40-50%
50–60%
60–70%
|
|
|
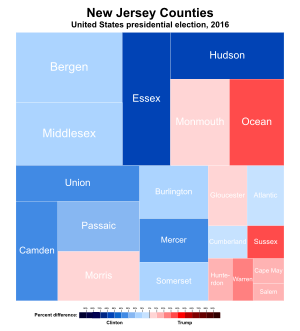
Treemap of the popular vote by county
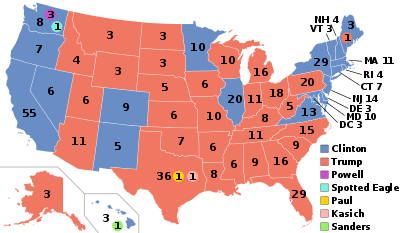
The 2016 United States presidential election in New Jersey was won by Hillary Clinton on November 8, 2016, with 55.5% of the vote over Donald Trump's 41.35%. New Jersey's 14 electoral votes were assigned to Clinton and her Vice Presidential running mate Tim Kaine.
Primary elections
New Jersey's presidential primaries were on June 7, 2016, with the Democratic, Republican, and Libertarian parties participating.[1] Registered members of each party could only vote in their party's primary, while voters who were unaffiliated could choose any one primary in which to vote.
Democratic primary
Two candidates appeared on the Democratic presidential primary ballot:[2]
Republican primary
Three candidates appeared on the Republican presidential primary ballot:[2]
| New Jersey Republican primary, June 7, 2016 |
| Candidate |
Votes |
Percentage |
Actual delegate count |
| Bound |
Unbound |
Total |
| Donald Trump |
360,212 |
80.41% |
51 |
0 |
51 |
| John Kasich (withdrawn) |
59,866 |
13.36% |
0 |
0 |
0 |
| Ted Cruz (withdrawn) |
27,874 |
6.22% |
0 |
0 |
0 |
| Unprojected delegates: |
0 |
0 |
0 |
| Total: |
447,952 |
100.00% |
51 |
0 |
51 |
| Source: The Green Papers |
General election
Candidate ballot access:[3]
Results
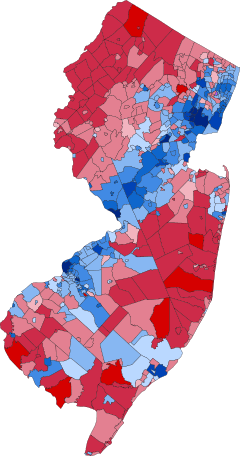
Results of the general election by
municipality, darker colors indicate higher win percentage:
-Blue municipalities won by Clinton
-Red municipalities won by Trump
-Purple municipality, Clinton and Trump tied (
Teterboro only)
United States presidential election in New Jersey, 2016[4]
| Party |
Candidate |
Votes |
% |
± |
|
Democratic |
Hillary Clinton |
2,148,278 |
55.45% |
|
|
Republican |
Donald Trump |
1,601,933 |
41.35% |
|
|
Libertarian |
Gary Johnson |
72,477 |
1.87% |
|
|
Green |
Jill Stein |
37,772 |
0.98% |
|
|
Constitution |
Darrell Castle |
6,161 |
0.16% |
|
|
Socialist Workers |
Alyson Kennedy |
2,156 |
0.06% |
|
|
American Delta Party |
Rocky De La Fuente |
1,838 |
0.05% |
|
|
Workers World |
Monica Moorehead |
1,749 |
0.05% |
|
|
Socialism and Liberation |
Gloria La Riva |
1,682 |
0.04% |
|
| Majority |
546,345 |
14.10% |
|
| Turnout |
3,874,046 |
|
|
Results by county
| County |
Clinton votes |
Clinton % |
Trump votes |
Trump % |
Other votes |
Other % |
| Atlantic | 60,924 | 51.0% | 52,690 | 44.1% | 5,802 | 4.9% |
| Bergen | 231,211 | 54.2% | 175,529 | 41.1% | 19,827 | 4.6% |
| Burlington | 121,725 | 54.2% | 89,272 | 39.7% | 13,617 | 6.0% |
| Camden | 146,717 | 63.4% | 72,631 | 31.4% | 12,131 | 5.2% |
| Cape May | 18,750 | 37.5% | 28,446 | 57.0% | 2,743 | 5.5% |
| Cumberland | 27,771 | 50.4% | 24,453 | 44.4% | 2,840 | 5.2% |
| Essex | 240,837 | 76.2% | 63,176 | 20.0% | 12,098 | 3.8% |
| Gloucester | 66,870 | 46.9% | 67,544 | 47.4% | 8,203 | 5.7% |
| Hudson | 163,917 | 73.2% | 49,043 | 21.9% | 10,909 | 4.9% |
| Hunterdon | 28,898 | 39.7% | 38,712 | 53.2% | 5,099 | 7.0% |
| Mercer | 104,775 | 65.6% | 46,193 | 28.9% | 8,770 | 5.5% |
| Middlesex | 193,044 | 58.0% | 122,953 | 37.0% | 16,518 | 5.0% |
| Monmouth | 137,181 | 42.3% | 166,723 | 51.5% | 20,014 | 6.2% |
| Morris | 115,249 | 44.9% | 126,071 | 49.1% | 15,197 | 5.9% |
| Ocean | 87,150 | 31.1% | 179,079 | 63.9% | 14,180 | 5.0% |
| Passaic | 116,759 | 58.8% | 72,902 | 36.7% | 8,816 | 4.4% |
| Salem | 11,904 | 39.6% | 16,381 | 54.4% | 1,799 | 6.0% |
| Somerset | 85,689 | 53.4% | 65,505 | 40.8% | 9,351 | 5.8% |
| Sussex | 24,212 | 32.0% | 46,658 | 61.8% | 4,676 | 6.2% |
| Union | 147,414 | 66.4% | 68,114 | 30.7% | 6,447 | 2.9% |
| Warren | 17,281 | 34.3% | 29,858 | 59.2% | 2,097 | 4.3% |
By congressional district
Clinton won 7 of 12 congressional districts.[5]
Analysis
Hillary Clinton 55.5% of the vote was 2.9 percentage points less Barack Obama's win in the state in 2012. This was the first time since 1976 that New Jersey did not vote for the same candidate as neighboring Pennsylvania.
References
|
|---|
|
| Republican Party | |
|---|
| Democratic Party | |
|---|
| Libertarian Party | |
|---|
| Green Party | |
|---|
| Constitution Party | |
|---|
| Independent | |
|---|
|
|
|---|
| Election timelines | |
|---|
| National polling | |
|---|
| State polling | |
|---|
| Fundraising | |
|---|
| Debates and forums | |
|---|
| Straw polls | |
|---|
| Major events | |
|---|
Caucuses
and primaries | |
|---|
| Results breakdown | |
|---|
National
conventions | |
|---|
| Reforms | |
|---|

.jpg)