United States presidential election in Kentucky, 2016
|
| ||||||||||||||||||||||||||
| ||||||||||||||||||||||||||
| Turnout |
59.10% | |||||||||||||||||||||||||
|---|---|---|---|---|---|---|---|---|---|---|---|---|---|---|---|---|---|---|---|---|---|---|---|---|---|---|
| ||||||||||||||||||||||||||
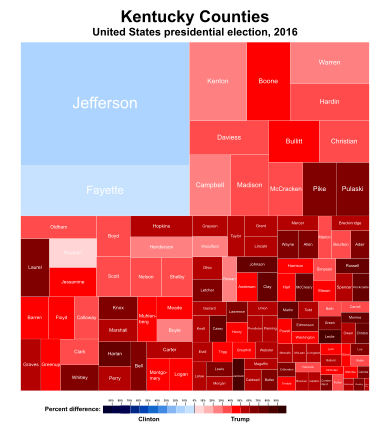
 County Results
| ||||||||||||||||||||||||||
| ||||||||||||||||||||||||||
.jpg)

| Elections in Kentucky |
|---|
 |
|
|
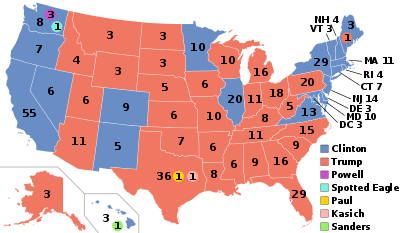
The 2016 United States presidential election in Kentucky was held on November 8, 2016, as part of the 2016 General Election in which all 50 states plus The District of Columbia participated. Kentucky voters chose electors to represent them in the Electoral College via a popular vote pitting the Republican Party's nominee, businessman Donald Trump, and running mate Indiana Governor Mike Pence against Democratic Party nominee, former Secretary of State Hillary Clinton and her running mate, Virginia Senator Tim Kaine.
On March 5 and May 17, 2016, in the presidential primaries, Kentucky voters expressed their preferences for the Democratic, Republican, and Libertarian parties' respective nominees for president. Registered members of each party only voted in their party's primary, while voters who were unaffiliated were unable to vote.
Although Kentucky was won twice by southern Democrat Bill Clinton in 1992 and 1996, Donald Trump easily carried Kentucky with 62.54% of the vote, to 32.69% of the vote for Hillary Clinton, a margin of 29.85%. Trump won Kentucky by the largest margin of any Republican since Richard Nixon in 1972, and swept counties across the state.[1] Clinton only carried the state's two most urban and populous counties, Jefferson County, home to Louisville, and Fayette County, home to Lexington, both of which traditionally vote Democratic.
Trump made history when he won Elliott County. In the nearly 150-year history of the county, it had voted Democratic in every presidential election, never Republican. Trump ended that tradition and won Elliott County handily with 2,000 votes to Clinton's 740, or 70%-26%.
Trump's victory in Kentucky made it his fifth strongest state in the 2016 election after Wyoming, West Virginia, Oklahoma and North Dakota[2].
Primary elections
Republican caucus

In order to avoid a local law forbidding one candidate to run for two offices in the same primary, Rand Paul paid to have a presidential caucus, which took place on March 5. Paul dropped out prior to this.[3]
| Kentucky Republican caucuses, March 5, 2016 | |||||
|---|---|---|---|---|---|
| Candidate | Votes | Percentage | Actual delegate count | ||
| Bound | Unbound | Total | |||
| 82,493 | 35.92% | 17 | 0 | 17 | |
| Ted Cruz | 72,503 | 31.57% | 15 | 0 | 15 |
| Marco Rubio | 37,579 | 16.36% | 7 | 0 | 7 |
| John Kasich | 33,134 | 14.43% | 7 | 0 | 7 |
| Ben Carson (withdrawn) | 1,951 | 0.85% | 0 | 0 | 0 |
| Rand Paul (withdrawn) | 872 | 0.38% | 0 | 0 | 0 |
| Uncommitted | 496 | 0.22% | 0 | 0 | 0 |
| Jeb Bush (withdrawn) | 305 | 0.13% | 0 | 0 | 0 |
| Mike Huckabee (withdrawn) | 174 | 0.08% | 0 | 0 | 0 |
| Chris Christie (withdrawn) | 65 | 0.03% | 0 | 0 | 0 |
| Carly Fiorina (withdrawn) | 64 | 0.03% | 0 | 0 | 0 |
| Rick Santorum (withdrawn) | 31 | 0.03% | 0 | 0 | 0 |
| Total: | 229,667 | 100.00% | 40 | 0 | 40 |
| Source: The Green Papers, Republican Party of Kentucky | |||||
Democratic primary
Four candidates appeared on the Democratic presidential primary ballot:
| Kentucky Democratic primary, May 17, 2016 | |||||
|---|---|---|---|---|---|
| Candidate | Popular vote | Estimated delegates | |||
| Count | Percentage | Pledged | Unpledged | Total | |
| Hillary Clinton | 212,534 | 46.76% | 28 | 2 | 30 |
| Bernie Sanders | 210,623 | 46.33% | 27 | 0 | 27 |
| Martin O'Malley (withdrawn) | 5,713 | 1.26% | |||
| Roque "Rocky" De La Fuente | 1,594 | 0.35% | |||
| Uncommitted | 24,104 | 5.30% | 0 | 3 | 3 |
| Total | 454,568 | 100% | 55 | 5 | 60 |
| Source: The Green Papers, Kentucky Secretary of State | |||||
Polling
Predictions
The following are final 2016 predictions from various organizations for Kentucky as of Election Day.
- Los Angeles Times: Strongly Trump[4]
- CNN: Solid Trump[5]
- Sabato's Crystal Ball: Safe Trump[6]
- NBC: Likely Trump[7]
- RealClearPolitics: Solid Trump[8]
- Fox News: Solid Republican[9]
- ABC: Solid Trump[10]
Results
By county
| County | Clinton% | Clinton# | Trump% | Trump# | Johnson% | Johnson# | McMullin% | McMullin# | Stein% | Stein# | Others% | Others# | Totals# |
|---|---|---|---|---|---|---|---|---|---|---|---|---|---|
| Adair | 16.07% | 1,323 | 80.61% | 6,637 | 1.71% | 141 | 1.12% | 92 | 0.43% | 35 | 0.06% | 5 | 8,233 |
| Allen | 16.66% | 1,349 | 79.87% | 6,466 | 1.99% | 161 | 0.78% | 63 | 0.57% | 46 | 0.14% | 11 | 8,096 |
| Anderson | 23.06% | 2,634 | 72.16% | 8,242 | 2.79% | 319 | 1.44% | 165 | 0.47% | 54 | 0.07% | 8 | 11,422 |
| Ballard | 19.90% | 816 | 77.08% | 3,161 | 1.88% | 77 | 0.56% | 23 | 0.49% | 20 | 0.10% | 4 | 4,101 |
| Barren | 23.12% | 4,275 | 72.93% | 13,483 | 2.46% | 455 | 0.90% | 167 | 0.50% | 93 | 0.08% | 15 | 18,488 |
| Bath | 29.67% | 1,361 | 67.19% | 3,082 | 1.64% | 75 | 0.76% | 35 | 0.52% | 24 | 0.22% | 10 | 4,587 |
| Bell | 17.70% | 1,720 | 79.89% | 7,764 | 1.48% | 144 | 0.45% | 44 | 0.43% | 42 | 0.04% | 4 | 9,718 |
| Boone | 26.08% | 15,026 | 67.83% | 39,082 | 3.99% | 2,299 | 1.32% | 763 | 0.66% | 380 | 0.12% | 68 | 57,618 |
| Bourbon | 31.71% | 2,791 | 63.26% | 5,569 | 3.21% | 283 | 1.09% | 96 | 0.59% | 52 | 0.14% | 12 | 8,803 |
| Boyd | 29.44% | 6,021 | 66.45% | 13,591 | 2.42% | 496 | 0.82% | 168 | 0.82% | 167 | 0.05% | 11 | 20,454 |
| Boyle | 33.07% | 4,281 | 62.10% | 8,040 | 2.82% | 365 | 1.31% | 169 | 0.56% | 73 | 0.14% | 18 | 12,946 |
| Bracken | 19.99% | 705 | 76.86% | 2,711 | 1.45% | 51 | 0.99% | 35 | 0.57% | 20 | 0.14% | 5 | 3,527 |
| Breathitt | 26.79% | 1,537 | 69.55% | 3,991 | 2.04% | 117 | 0.84% | 48 | 0.61% | 35 | 0.17% | 10 | 5,738 |
| Breckinridge | 22.34% | 1,960 | 73.90% | 6,484 | 2.21% | 194 | 0.91% | 80 | 0.54% | 47 | 0.10% | 9 | 8,774 |
| Bullitt | 22.89% | 8,255 | 72.67% | 26,210 | 2.67% | 964 | 0.98% | 354 | 0.70% | 253 | 0.09% | 33 | 36,069 |
| Butler | 16.98% | 947 | 79.41% | 4,428 | 2.44% | 136 | 0.95% | 53 | 0.00% | 0 | 0.22% | 12 | 5,576 |
| Caldwell | 21.09% | 1,260 | 75.43% | 4,507 | 1.97% | 118 | 0.92% | 55 | 0.54% | 32 | 0.05% | 3 | 5,975 |
| Calloway | 29.59% | 4,749 | 64.60% | 10,367 | 3.07% | 492 | 1.75% | 281 | 0.93% | 150 | 0.06% | 10 | 16,049 |
| Campbell | 34.48% | 14,658 | 58.93% | 25,050 | 4.21% | 1,789 | 1.30% | 552 | 0.99% | 422 | 0.09% | 39 | 42,510 |
| Carlisle | 16.61% | 432 | 80.51% | 2,094 | 1.61% | 42 | 0.73% | 19 | 0.46% | 12 | 0.08% | 2 | 2,601 |
| Carroll | 28.69% | 1,106 | 67.13% | 2,588 | 2.59% | 100 | 0.86% | 33 | 0.62% | 24 | 0.10% | 4 | 3,855 |
| Carter | 22.14% | 2,276 | 73.82% | 7,587 | 2.31% | 237 | 1.06% | 109 | 0.56% | 58 | 0.11% | 11 | 10,278 |
| Casey | 11.91% | 767 | 85.14% | 5,482 | 1.88% | 121 | 0.62% | 40 | 0.43% | 28 | 0.02% | 1 | 6,439 |
| Christian | 32.55% | 7,188 | 63.89% | 14,108 | 2.15% | 474 | 0.81% | 179 | 0.54% | 120 | 0.06% | 14 | 22,083 |
| Clark | 29.04% | 4,706 | 66.09% | 10,710 | 2.80% | 453 | 1.25% | 203 | 0.75% | 121 | 0.07% | 12 | 16,205 |
| Clay | 11.11% | 752 | 86.61% | 5,861 | 1.23% | 83 | 0.59% | 40 | 0.38% | 26 | 0.07% | 5 | 6,767 |
| Clinton | 12.26% | 547 | 85.37% | 3,809 | 1.34% | 60 | 0.52% | 23 | 0.34% | 15 | 0.18% | 8 | 4,462 |
| Crittenden | 15.28% | 617 | 81.50% | 3,290 | 1.88% | 76 | 0.89% | 36 | 0.42% | 17 | 0.02% | 1 | 4,037 |
| Cumberland | 14.97% | 459 | 81.60% | 2,502 | 2.19% | 67 | 0.72% | 22 | 0.36% | 11 | 0.16% | 5 | 3,066 |
| Daviess | 30.92% | 14,163 | 63.11% | 28,907 | 3.25% | 1,488 | 1.62% | 741 | 0.99% | 453 | 0.12% | 55 | 45,807 |
| Edmonson | 18.67% | 979 | 78.85% | 4,135 | 1.47% | 77 | 0.53% | 28 | 0.38% | 20 | 0.10% | 5 | 5,244 |
| Elliott | 25.92% | 740 | 70.05% | 2,000 | 2.35% | 67 | 0.74% | 21 | 0.67% | 19 | 0.28% | 8 | 2,855 |
| Estill | 19.98% | 1,108 | 76.39% | 4,236 | 2.33% | 129 | 0.63% | 35 | 0.54% | 30 | 0.13% | 7 | 5,545 |
| Fayette | 51.19% | 69,778 | 41.74% | 56,894 | 3.84% | 5,230 | 1.93% | 2,636 | 1.16% | 1,580 | 0.14% | 197 | 136,315 |
| Fleming | 21.53% | 1,348 | 75.43% | 4,722 | 1.74% | 109 | 0.81% | 51 | 0.32% | 20 | 0.16% | 10 | 6,260 |
| Floyd | 24.27% | 4,015 | 72.51% | 11,993 | 2.16% | 357 | 0.60% | 100 | 0.34% | 56 | 0.11% | 19 | 16,540 |
| Franklin | 44.91% | 10,717 | 49.52% | 11,819 | 3.04% | 725 | 1.44% | 343 | 0.99% | 236 | 0.10% | 25 | 23,865 |
| Fulton | 32.49% | 774 | 65.03% | 1,549 | 1.47% | 35 | 0.67% | 16 | 0.29% | 7 | 0.04% | 1 | 2,382 |
| Gallatin | 22.44% | 749 | 73.19% | 2,443 | 3.00% | 100 | 0.72% | 24 | 0.54% | 18 | 0.12% | 4 | 3,338 |
| Garrard | 19.06% | 1,453 | 77.45% | 5,904 | 2.06% | 157 | 0.87% | 66 | 0.43% | 33 | 0.13% | 10 | 7,623 |
| Grant | 19.98% | 1,910 | 76.03% | 7,268 | 2.36% | 226 | 0.80% | 76 | 0.74% | 71 | 0.08% | 8 | 9,559 |
| Graves | 19.92% | 3,308 | 76.30% | 12,671 | 2.48% | 411 | 0.67% | 112 | 0.48% | 80 | 0.14% | 24 | 16,606 |
| Grayson | 18.52% | 1,959 | 77.71% | 8,219 | 2.45% | 259 | 0.77% | 81 | 0.43% | 46 | 0.11% | 12 | 10,576 |
| Green | 15.60% | 832 | 81.98% | 4,372 | 1.58% | 84 | 0.36% | 19 | 0.45% | 24 | 0.04% | 2 | 5,333 |
| Greenup | 25.47% | 4,146 | 70.93% | 11,546 | 1.96% | 319 | 0.89% | 145 | 0.67% | 109 | 0.07% | 12 | 16,277 |
| Hancock | 28.96% | 1,244 | 64.91% | 2,788 | 3.00% | 129 | 2.03% | 87 | 1.02% | 44 | 0.07% | 3 | 4,295 |
| Hardin | 32.31% | 13,944 | 62.50% | 26,971 | 3.27% | 1,413 | 1.02% | 440 | 0.80% | 346 | 0.10% | 42 | 43,156 |
| Harlan | 12.75% | 1,372 | 84.87% | 9,129 | 1.45% | 156 | 0.45% | 48 | 0.36% | 39 | 0.12% | 13 | 10,757 |
| Harrison | 26.10% | 2,031 | 69.85% | 5,435 | 2.36% | 184 | 1.00% | 78 | 0.59% | 46 | 0.09% | 7 | 7,781 |
| Hart | 23.82% | 1,730 | 73.24% | 5,320 | 1.93% | 140 | 0.44% | 32 | 0.54% | 39 | 0.04% | 3 | 7,264 |
| Henderson | 34.03% | 6,707 | 61.69% | 12,159 | 2.57% | 507 | 0.90% | 177 | 0.72% | 142 | 0.09% | 18 | 19,710 |
| Henry | 25.57% | 1,828 | 69.16% | 4,944 | 3.13% | 224 | 1.23% | 88 | 0.81% | 58 | 0.10% | 7 | 7,149 |
| Hickman | 20.82% | 449 | 76.82% | 1,657 | 1.21% | 26 | 0.88% | 19 | 0.28% | 6 | 0.00% | 0 | 2,157 |
| Hopkins | 21.18% | 4,310 | 75.09% | 15,277 | 2.35% | 478 | 0.80% | 163 | 0.48% | 97 | 0.10% | 20 | 20,345 |
| Jackson | 8.76% | 482 | 88.87% | 4,889 | 1.44% | 79 | 0.49% | 27 | 0.36% | 20 | 0.07% | 4 | 5,501 |
| Jefferson | 54.05% | 190,836 | 40.72% | 143,768 | 2.89% | 10,188 | 1.36% | 4,785 | 0.91% | 3,224 | 0.08% | 298 | 353,099 |
| Jessamine | 26.34% | 6,144 | 66.34% | 15,474 | 3.55% | 829 | 2.89% | 675 | 0.73% | 170 | 0.15% | 34 | 23,326 |
| Johnson | 13.06% | 1,250 | 84.03% | 8,043 | 1.70% | 163 | 0.46% | 44 | 0.63% | 60 | 0.13% | 12 | 9,572 |
| Kenton | 33.63% | 24,214 | 59.67% | 42,958 | 4.30% | 3,093 | 1.30% | 938 | 0.98% | 703 | 0.13% | 92 | 71,998 |
| Knott | 21.60% | 1,245 | 75.60% | 4,357 | 1.77% | 102 | 0.68% | 39 | 0.00% | 0 | 0.35% | 20 | 5,763 |
| Knox | 14.66% | 1,761 | 82.29% | 9,885 | 1.57% | 189 | 0.85% | 102 | 0.53% | 64 | 0.09% | 11 | 12,012 |
| LaRue | 20.07% | 1,278 | 75.37% | 4,799 | 2.73% | 174 | 1.26% | 80 | 0.44% | 28 | 0.13% | 8 | 6,367 |
| Laurel | 13.85% | 3,440 | 82.92% | 20,592 | 1.90% | 473 | 0.77% | 192 | 0.46% | 114 | 0.09% | 22 | 24,833 |
| Lawrence | 17.30% | 1,045 | 79.71% | 4,816 | 1.77% | 107 | 0.61% | 37 | 0.53% | 32 | 0.08% | 5 | 6,042 |
| Lee | 16.65% | 444 | 80.65% | 2,151 | 1.57% | 42 | 0.71% | 19 | 0.26% | 7 | 0.15% | 4 | 2,667 |
| Leslie | 8.90% | 400 | 89.38% | 4,015 | 0.87% | 39 | 0.40% | 18 | 0.33% | 15 | 0.11% | 5 | 4,492 |
| Letcher | 16.88% | 1,542 | 79.84% | 7,293 | 2.30% | 210 | 0.54% | 49 | 0.41% | 37 | 0.03% | 3 | 9,134 |
| Lewis | 14.82% | 785 | 82.35% | 4,363 | 1.79% | 95 | 0.64% | 34 | 0.30% | 16 | 0.09% | 5 | 5,298 |
| Lincoln | 19.51% | 1,865 | 76.75% | 7,338 | 2.36% | 226 | 0.86% | 82 | 0.46% | 44 | 0.06% | 6 | 9,561 |
| Livingston | 19.10% | 887 | 76.86% | 3,570 | 2.48% | 115 | 0.99% | 46 | 0.52% | 24 | 0.06% | 3 | 4,645 |
| Logan | 25.28% | 2,755 | 71.36% | 7,778 | 2.10% | 229 | 0.83% | 91 | 0.39% | 43 | 0.03% | 3 | 10,899 |
| Lyon | 26.38% | 1,045 | 70.39% | 2,789 | 1.87% | 74 | 0.91% | 36 | 0.38% | 15 | 0.08% | 3 | 3,962 |
| Madison | 31.56% | 11,793 | 62.70% | 23,431 | 3.18% | 1,189 | 1.48% | 552 | 0.94% | 353 | 0.14% | 53 | 37,371 |
| Magoffin | 22.91% | 1,172 | 74.75% | 3,824 | 1.29% | 66 | 0.66% | 34 | 0.33% | 17 | 0.06% | 3 | 5,116 |
| Marion | 33.03% | 2,679 | 63.15% | 5,122 | 2.65% | 215 | 0.73% | 59 | 0.41% | 33 | 0.04% | 3 | 8,111 |
| Marshall | 21.99% | 3,672 | 73.79% | 12,322 | 2.55% | 426 | 1.04% | 174 | 0.50% | 84 | 0.12% | 20 | 16,698 |
| Martin | 9.18% | 363 | 88.62% | 3,503 | 1.32% | 52 | 0.51% | 20 | 0.33% | 13 | 0.05% | 2 | 3,953 |
| Mason | 27.29% | 1,970 | 68.49% | 4,944 | 2.40% | 173 | 1.21% | 87 | 0.53% | 38 | 0.10% | 7 | 7,219 |
| McCracken | 29.18% | 9,134 | 66.36% | 20,774 | 2.68% | 839 | 1.02% | 320 | 0.69% | 217 | 0.07% | 23 | 31,307 |
| McCreary | 11.50% | 664 | 86.77% | 5,012 | 1.02% | 59 | 0.33% | 19 | 0.31% | 18 | 0.07% | 4 | 5,776 |
| McLean | 21.64% | 988 | 74.05% | 3,381 | 3.00% | 137 | 0.96% | 44 | 0.33% | 15 | 0.02% | 1 | 4,566 |
| Meade | 24.74% | 3,026 | 70.80% | 8,660 | 2.72% | 333 | 0.87% | 107 | 0.79% | 97 | 0.07% | 8 | 12,231 |
| Menifee | 25.19% | 700 | 72.33% | 2,010 | 1.55% | 43 | 0.50% | 14 | 0.40% | 11 | 0.04% | 1 | 2,779 |
| Mercer | 22.63% | 2,395 | 73.12% | 7,740 | 2.60% | 275 | 0.95% | 101 | 0.64% | 68 | 0.06% | 6 | 10,585 |
| Metcalfe | 21.13% | 976 | 75.56% | 3,491 | 1.86% | 86 | 0.89% | 41 | 0.48% | 22 | 0.09% | 4 | 4,620 |
| Monroe | 12.04% | 601 | 85.71% | 4,278 | 1.52% | 76 | 0.46% | 23 | 0.26% | 13 | 0.00% | 0 | 4,991 |
| Montgomery | 27.58% | 3,158 | 68.60% | 7,856 | 2.31% | 264 | 0.79% | 91 | 0.59% | 68 | 0.13% | 15 | 11,452 |
| Morgan | 21.07% | 1,006 | 75.98% | 3,628 | 1.32% | 63 | 0.90% | 43 | 0.54% | 26 | 0.19% | 9 | 4,775 |
| Muhlenberg | 25.05% | 3,272 | 71.92% | 9,393 | 1.76% | 230 | 0.82% | 107 | 0.34% | 44 | 0.11% | 14 | 13,060 |
| Nelson | 30.93% | 6,434 | 64.57% | 13,431 | 2.72% | 565 | 0.97% | 201 | 0.63% | 131 | 0.19% | 40 | 20,802 |
| Nicholas | 27.70% | 787 | 68.88% | 1,957 | 2.29% | 65 | 0.67% | 19 | 0.32% | 9 | 0.14% | 4 | 2,841 |
| Ohio | 20.00% | 2,080 | 76.38% | 7,942 | 1.99% | 207 | 1.01% | 105 | 0.62% | 64 | 0.00% | 0 | 10,398 |
| Oldham | 31.25% | 10,268 | 62.30% | 20,469 | 3.74% | 1,229 | 1.80% | 590 | 0.86% | 282 | 0.05% | 15 | 32,853 |
| Owen | 21.24% | 1,062 | 74.89% | 3,745 | 2.44% | 122 | 0.86% | 43 | 0.50% | 25 | 0.08% | 4 | 5,001 |
| Owsley | 14.55% | 256 | 83.80% | 1,474 | 1.36% | 24 | 0.00% | 0 | 0.00% | 0 | 0.28% | 5 | 1,759 |
| Pendleton | 19.38% | 1,164 | 76.64% | 4,604 | 2.41% | 145 | 1.10% | 66 | 0.45% | 27 | 0.02% | 1 | 6,007 |
| Perry | 20.20% | 2,136 | 77.17% | 8,158 | 1.59% | 168 | 0.54% | 57 | 0.44% | 47 | 0.06% | 6 | 10,572 |
| Pike | 17.35% | 4,280 | 80.06% | 19,747 | 1.67% | 413 | 0.50% | 124 | 0.35% | 86 | 0.06% | 15 | 24,665 |
| Powell | 25.66% | 1,272 | 70.87% | 3,513 | 2.38% | 118 | 0.44% | 22 | 0.54% | 27 | 0.10% | 5 | 4,957 |
| Pulaski | 15.01% | 4,208 | 81.67% | 22,902 | 2.00% | 562 | 0.78% | 218 | 0.45% | 127 | 0.09% | 24 | 28,041 |
| Robertson | 21.92% | 222 | 74.93% | 759 | 1.88% | 19 | 0.79% | 8 | 0.49% | 5 | 0.00% | 0 | 1,013 |
| Rockcastle | 13.68% | 915 | 83.83% | 5,609 | 1.30% | 87 | 0.75% | 50 | 0.37% | 25 | 0.07% | 5 | 6,691 |
| Rowan | 37.24% | 3,295 | 58.48% | 5,174 | 2.34% | 207 | 0.77% | 68 | 0.96% | 85 | 0.21% | 19 | 8,848 |
| Russell | 13.37% | 1,093 | 83.96% | 6,863 | 1.87% | 153 | 0.59% | 48 | 0.00% | 0 | 0.21% | 17 | 8,174 |
| Scott | 31.88% | 7,715 | 62.20% | 15,052 | 3.52% | 853 | 1.66% | 402 | 0.57% | 139 | 0.16% | 39 | 24,200 |
| Shelby | 30.50% | 6,276 | 64.12% | 13,196 | 3.06% | 629 | 1.57% | 324 | 0.67% | 138 | 0.08% | 17 | 20,580 |
| Simpson | 28.47% | 2,144 | 67.41% | 5,077 | 2.66% | 200 | 0.86% | 65 | 0.50% | 38 | 0.09% | 7 | 7,531 |
| Spencer | 20.19% | 1,921 | 75.63% | 7,196 | 2.49% | 237 | 1.17% | 111 | 0.46% | 44 | 0.06% | 6 | 9,515 |
| Taylor | 22.58% | 2,553 | 73.59% | 8,320 | 2.06% | 233 | 1.26% | 142 | 0.47% | 53 | 0.04% | 5 | 11,306 |
| Todd | 21.80% | 1,042 | 75.58% | 3,612 | 1.34% | 64 | 0.56% | 27 | 0.54% | 26 | 0.17% | 8 | 4,779 |
| Trigg | 23.51% | 1,587 | 73.04% | 4,931 | 1.79% | 121 | 0.87% | 59 | 0.67% | 45 | 0.12% | 8 | 6,751 |
| Trimble | 23.14% | 879 | 72.96% | 2,771 | 2.32% | 88 | 0.74% | 28 | 0.53% | 20 | 0.31% | 12 | 3,798 |
| Union | 21.43% | 1,331 | 75.69% | 4,701 | 1.85% | 115 | 0.53% | 33 | 0.47% | 29 | 0.03% | 2 | 6,211 |
| Warren | 35.01% | 16,966 | 59.18% | 28,673 | 3.31% | 1,605 | 1.56% | 757 | 0.86% | 415 | 0.08% | 38 | 48,454 |
| Washington | 25.20% | 1,420 | 71.20% | 4,013 | 1.97% | 111 | 1.06% | 60 | 0.30% | 17 | 0.27% | 15 | 5,636 |
| Wayne | 17.91% | 1,431 | 79.72% | 6,371 | 1.45% | 116 | 0.51% | 41 | 0.38% | 30 | 0.04% | 3 | 7,992 |
| Webster | 21.36% | 1,240 | 75.75% | 4,397 | 1.91% | 111 | 0.59% | 34 | 0.38% | 22 | 0.02% | 1 | 5,805 |
| Whitley | 15.01% | 2,067 | 82.13% | 11,312 | 1.76% | 242 | 0.75% | 103 | 0.30% | 41 | 0.07% | 9 | 13,774 |
| Wolfe | 28.58% | 753 | 68.46% | 1,804 | 1.59% | 42 | 0.99% | 26 | 0.34% | 9 | 0.04% | 1 | 2,635 |
| Woodford | 36.56% | 4,958 | 56.75% | 7,697 | 3.90% | 529 | 1.81% | 246 | 0.86% | 117 | 0.12% | 16 | 13,563 |
| Totals | 32.68% | 628,854 | 62.52% | 1,202,971 | 2.79% | 53,752 | 1.18% | 22,780 | 0.72% | 13,913 | 0.10% | 1,879 | 1,924,149 |
By congressional district
Trump won 5 of 6 congressional districts.
| District | Trump | Clinton | Representative |
|---|---|---|---|
| 1st | 72% | 24% | Ed Whitfield |
| James Comer | |||
| 2nd | 68% | 28% | Brett Guthrie |
| 3rd | 40% | 55% | John Yarmuth |
| 4th | 65% | 29% | Thomas Massie |
| 5th | 80% | 18% | Hal Rogers |
| 6th | 55% | 39% | Andy Barr |
Counties that swung from Democratic to Republican
- Elliot (largest city: Sandy Hook)
- Franklin (largest city: Frankfort)
See also
References
- ↑ "Presidential General Election Results Comparison - Kentucky". Uselectionatlas.org. Retrieved 2016-11-13.
- ↑ "2016 Presidential Election Statistics". Dave Leip’s Atlas of U.S. Presidential Elections. Retrieved 2018-03-05.
- ↑ "Kentucky caucus moves forward without Rand Paul | News". Richmondregister.com. 2016-02-14. Retrieved 2016-11-13.
- ↑ "Our final map has Clinton winning with 352 electoral votes. Compare your picks with ours". Los Angeles Times. 2016-11-06. Retrieved 2016-11-13.
- ↑ "Road to 270: CNN's general election map - CNNPolitics.com". Cnn.com. 2016-11-08. Retrieved 2016-11-13.
- ↑ "Larry J. Sabato's Crystal Ball » 2016 President". Centerforpolitics.org. 2016-11-07. Retrieved 2016-11-13.
- ↑ Todd, Chuck. "NBC's Final Battleground Map Shows Clinton With a Significant Lead". NBC News. Retrieved 2016-11-13.
- ↑ "2016 Election Maps - Battle for White House". RealClearPolitics. Retrieved 2016-11-13.
- ↑ "Electoral Scorecard: Map shifts again in Trump's favor, as Clinton holds edge". Fox News. 2016-11-07. Retrieved 2016-11-13.
- ↑ "The Final 15: The Latest Polls in the Swing States That Will Decide the Election". Abcnews.go.com. 2016-11-07. Retrieved 2016-11-13.
External links
- RNC 2016 Republican Nominating Process
- Green papers for 2016 primaries, caucuses, and conventions
- 2016 Presidential primaries, ElectionProjection.com
- Decision Desk Headquarter Results for Kentucky