Fayette County, Illinois
| Fayette County, Illinois | |
|---|---|
 Fayette County Courthouse in Vandalia | |
 Location in the U.S. state of Illinois | |
 Illinois's location in the U.S. | |
| Founded | 1821 |
| Named for | Marquis de Lafayette |
| Seat | Vandalia |
| Largest city | Vandalia |
| Area | |
| • Total | 725 sq mi (1,878 km2) |
| • Land | 716 sq mi (1,854 km2) |
| • Water | 8.9 sq mi (23 km2), 1.2% |
| Population | |
| • (2010) | 22,140 |
| • Density | 31/sq mi (12/km2) |
| Congressional district | 15th |
| Time zone | Central: UTC−6/−5 |
| Website |
www |
Fayette County is a county located in the U.S. state of Illinois. As of the 2010 census, the population was 22,140.[1] Its county seat is Vandalia.[2] Ramsey Lake State Recreation Area is located in the northwest part of this county.
History
Fayette County was formed in 1821 out of Bond, Clark, and Crawford counties. It was named in honor of the Marquis de LaFayette, French hero of the American Revolutionary War.[3][4]
 Fayette County between the time of its creation and 1823
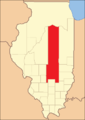 Fayette between 1823 and 1824
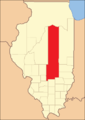 Fayette between 1824 and 1827
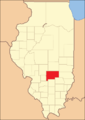 Fayette between 1827 and 1831
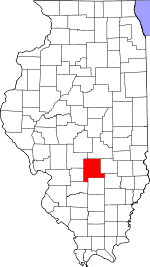
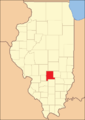 Fayette in 1831, when the creation of Effingham County reduced it to its current size
Geography
According to the U.S. Census Bureau, the county has a total area of 725 square miles (1,880 km2), of which 716 square miles (1,850 km2) is land and 8.9 square miles (23 km2) (1.2%) is water.[5]
Climate and weather
| Vandalia, Illinois | ||||||||||||||||||||||||||||||||||||||||||||||||||||||||||||
|---|---|---|---|---|---|---|---|---|---|---|---|---|---|---|---|---|---|---|---|---|---|---|---|---|---|---|---|---|---|---|---|---|---|---|---|---|---|---|---|---|---|---|---|---|---|---|---|---|---|---|---|---|---|---|---|---|---|---|---|---|
| Climate chart (explanation) | ||||||||||||||||||||||||||||||||||||||||||||||||||||||||||||
| ||||||||||||||||||||||||||||||||||||||||||||||||||||||||||||
| ||||||||||||||||||||||||||||||||||||||||||||||||||||||||||||
In recent years, average temperatures in the county seat of Vandalia have ranged from a low of 18 °F (−8 °C) in January to a high of 88 °F (31 °C) in July, although a record low of −21 °F (−29 °C) was recorded in January 1985 and a record high of 104 °F (40 °C) was recorded in July 1980. Average monthly precipitation ranged from 2.41 inches (61 mm) in February to 4.11 inches (104 mm) in May.[6]
Adjacent counties
- Shelby County - northeast
- Effingham County - east
- Clay County - southeast
- Marion County - south
- Clinton County - southwest
- Bond County - west
- Montgomery County - northwest
Major highways
Demographics
| Historical population | |||
|---|---|---|---|
| Census | Pop. | %± | |
| 1830 | 2,704 | — | |
| 1840 | 6,328 | 134.0% | |
| 1850 | 8,075 | 27.6% | |
| 1860 | 11,189 | 38.6% | |
| 1870 | 19,638 | 75.5% | |
| 1880 | 23,241 | 18.3% | |
| 1890 | 23,367 | 0.5% | |
| 1900 | 28,065 | 20.1% | |
| 1910 | 28,075 | 0.0% | |
| 1920 | 26,187 | −6.7% | |
| 1930 | 23,487 | −10.3% | |
| 1940 | 29,159 | 24.1% | |
| 1950 | 24,582 | −15.7% | |
| 1960 | 21,946 | −10.7% | |
| 1970 | 20,752 | −5.4% | |
| 1980 | 22,167 | 6.8% | |
| 1990 | 20,893 | −5.7% | |
| 2000 | 21,802 | 4.4% | |
| 2010 | 22,140 | 1.6% | |
| Est. 2016 | 21,789 | [7] | −1.6% |
| U.S. Decennial Census[8] 1790-1960[9] 1900-1990[10] 1990-2000[11] 2010-2013[1] | |||
As of the 2010 United States Census, there were 22,140 people, 8,311 households, and 5,648 families residing in the county.[12] The population density was 30.9 inhabitants per square mile (11.9/km2). There were 9,302 housing units at an average density of 13.0 per square mile (5.0/km2).[5] The racial makeup of the county was 93.7% white, 4.4% black or African American, 0.2% Asian, 0.2% American Indian, 0.4% from other races, and 1.0% from two or more races. Those of Hispanic or Latino origin made up 1.4% of the population.[12] In terms of ancestry, 27.5% were German, 10.5% were English, 9.4% were American, and 9.3% were Irish.[13]
Of the 8,311 households, 31.2% had children under the age of 18 living with them, 53.3% were married couples living together, 9.7% had a female householder with no husband present, 32.0% were non-families, and 27.2% of all households were made up of individuals. The average household size was 2.45 and the average family size was 2.95. The median age was 39.9 years.[12]
The median income for a household in the county was $41,269 and the median income for a family was $51,216. Males had a median income of $38,257 versus $27,188 for females. The per capita income for the county was $21,663. About 10.8% of families and 16.1% of the population were below the poverty line, including 22.6% of those under age 18 and 12.0% of those age 65 or over.[14]
Communities
Cities
Villages
Unincorporated communities
Townships
Fayette County is divided into twenty townships:
Politics
| Year | Republican | Democratic | Third Parties |
|---|---|---|---|
| 2016 | 76.9% 7,372 | 19.0% 1,819 | 4.2% 400 |
| 2012 | 66.0% 5,951 | 31.7% 2,853 | 2.3% 208 |
| 2008 | 56.6% 5,499 | 40.9% 3,967 | 2.5% 242 |
| 2004 | 61.6% 5,880 | 37.4% 3,571 | 1.0% 98 |
| 2000 | 55.7% 5,200 | 41.6% 3,886 | 2.7% 252 |
| 1996 | 44.1% 3,881 | 44.2% 3,887 | 11.6% 1,024 |
| 1992 | 34.7% 3,508 | 47.8% 4,833 | 17.6% 1,777 |
| 1988 | 53.9% 5,452 | 45.8% 4,632 | 0.3% 34 |
| 1984 | 63.1% 6,607 | 36.7% 3,844 | 0.2% 22 |
| 1980 | 62.7% 6,523 | 34.7% 3,614 | 2.6% 271 |
| 1976 | 49.3% 5,059 | 50.0% 5,128 | 0.7% 68 |
| 1972 | 61.1% 6,574 | 38.9% 4,192 | 0.0% 2 |
| 1968 | 52.4% 5,449 | 38.6% 4,011 | 9.1% 943 |
| 1964 | 41.6% 4,492 | 58.4% 6,295 | |
| 1960 | 57.3% 6,586 | 42.7% 4,907 | 0.1% 11 |
| 1956 | 57.8% 6,739 | 42.2% 4,914 | 0.0% 5 |
| 1952 | 57.0% 7,028 | 43.0% 5,299 | 0.1% 12 |
| 1948 | 49.3% 5,717 | 49.7% 5,771 | 1.0% 120 |
| 1944 | 53.3% 6,332 | 45.7% 5,435 | 1.0% 120 |
| 1940 | 50.2% 7,486 | 48.9% 7,286 | 1.0% 143 |
| 1936 | 48.0% 6,419 | 51.0% 6,824 | 1.0% 128 |
| 1932 | 41.4% 5,122 | 57.1% 7,053 | 1.5% 185 |
| 1928 | 61.7% 6,545 | 37.7% 3,998 | 0.7% 73 |
| 1924 | 48.4% 5,010 | 45.1% 4,668 | 6.4% 666 |
| 1920 | 58.5% 5,758 | 38.8% 3,824 | 2.7% 264 |
| 1916 | 46.6% 5,316 | 49.7% 5,669 | 3.8% 434 |
| 1912 | 24.5% 1,481 | 46.0% 2,782 | 29.4% 1,779 |
| 1908 | 48.7% 3,261 | 47.7% 3,193 | 3.7% 246 |
| 1904 | 51.6% 3,253 | 42.1% 2,650 | 6.3% 399 |
| 1900 | 44.8% 2,920 | 52.5% 3,423 | 2.7% 176 |
| 1896 | 42.5% 2,769 | 55.6% 3,627 | 1.9% 126 |
| 1892 | 36.7% 1,980 | 45.1% 2,433 | 18.3% 988 |
Until the beginning of the twentieth century, Fayette County was rock-ribbed Democratic. It was not won by a Republican until Theodore Roosevelt’s landslide win of 1904. The county voted after that for the winning candidate in every election until 1940, when opposition to Franklin D. Roosevelt’s economic and war policies gave the county to Wendell Willkie. Since then only two Democratic presidential candidates have gained an absolute majority in the county – the more recent of these two, Jimmy Carter in 1976, doing so by a single vote. Like all of the Upland South the county has seen a rapid swing to the Republicans in recent elections due to opposition to the Democratic Party’s liberal views on social issues: Hillary Clinton’s 2016 tally of 19.0 percent of the county’s vote is 15.7 percent worse than any Democrat before 2012.
See also
References
- United States Census Bureau 2007 TIGER/Line Shapefiles
- United States Board on Geographic Names (GNIS)
- United States National Atlas
- 1 2 "State & County QuickFacts". United States Census Bureau. Archived from the original on July 10, 2011. Retrieved July 5, 2014.
- ↑ "Find a County". National Association of Counties. Archived from the original on May 10, 2015. Retrieved 2011-06-07.
- ↑ Allan H. Keith, Historical Stories: About Greenville and Bond County, IL. Consulted on August 15, 2007.
- ↑ Gannett, Henry (1905). The Origin of Certain Place Names in the United States. Govt. Print. Off. p. 124.
- 1 2 "Population, Housing Units, Area, and Density: 2010 - County". United States Census Bureau. Retrieved 2015-07-11.
- 1 2 "Monthly Averages for Vandalia, Illinois". The Weather Channel. Archived from the original on 2012-10-23. Retrieved 2011-01-27.
- ↑ "Population and Housing Unit Estimates". Archived from the original on May 29, 2017. Retrieved June 9, 2017.
- ↑ "U.S. Decennial Census". United States Census Bureau. Archived from the original on May 12, 2015. Retrieved July 5, 2014.
- ↑ "Historical Census Browser". University of Virginia Library. Archived from the original on August 16, 2012. Retrieved July 5, 2014.
- ↑ "Population of Counties by Decennial Census: 1900 to 1990". United States Census Bureau. Archived from the original on April 24, 2014. Retrieved July 5, 2014.
- ↑ "Census 2000 PHC-T-4. Ranking Tables for Counties: 1990 and 2000" (PDF). United States Census Bureau. Archived (PDF) from the original on December 18, 2014. Retrieved July 5, 2014.
- 1 2 3 "DP-1 Profile of General Population and Housing Characteristics: 2010 Demographic Profile Data". United States Census Bureau. Retrieved 2015-07-11.
- ↑ "DP02 SELECTED SOCIAL CHARACTERISTICS IN THE UNITED STATES – 2006-2010 American Community Survey 5-Year Estimates". United States Census Bureau. Retrieved 2015-07-11.
- ↑ "DP03 SELECTED ECONOMIC CHARACTERISTICS – 2006-2010 American Community Survey 5-Year Estimates". United States Census Bureau. Retrieved 2015-07-11.
- ↑ Leip, David. "Dave Leip's Atlas of U.S. Presidential Elections". uselectionatlas.org. Archived from the original on 23 March 2018. Retrieved 30 April 2018.
Places adjacent to Fayette County, Illinois | ||||||||||
|---|---|---|---|---|---|---|---|---|---|---|
| ||||||||||
Municipalities and communities of Fayette County, Illinois, United States | ||
|---|---|---|
| Cities | ||
| Villages | ||
| Townships | ||
| Unincorporated communities | ||
