Schuyler County, Illinois
| Schuyler County, Illinois | |
|---|---|
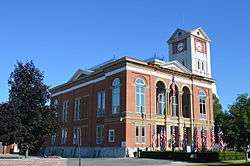 Schuyler County Courthouse, Rushville | |
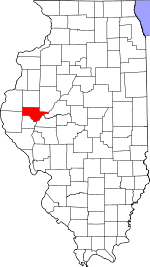 Location in the U.S. state of Illinois | |
 Illinois's location in the U.S. | |
| Founded | 1825 |
| Named for | Philip Schuyler |
| Seat | Rushville |
| Largest city | Rushville |
| Area | |
| • Total | 441 sq mi (1,142 km2) |
| • Land | 437 sq mi (1,132 km2) |
| • Water | 4.1 sq mi (11 km2), 0.9% |
| Population | |
| • (2010) | 7,544 |
| • Density | 17/sq mi (7/km2) |
| Congressional district | 18th |
| Time zone | Central: UTC−6/−5 |
| Website |
www |
Schuyler County is a county in the U.S. state of Illinois. According to the 2010 census, it had a population of 7,544.[1] Its county seat is Rushville.[2]
History
Schuyler County was formed in 1825 out of Pike and Fulton counties. It is named in honor of Philip Schuyler, member of the Continental Congress and Senator from New York.
 Schuyler County for the first year after its creation, including a tract of unorganized territory temporarily attached to it. Warren and Mercer Counties were also attached to Schuyler until they could organize their own county governments.[3]
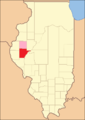 Schuyler County between 1826 and 1830. Mercer and Warren were attached to Peoria County, and the unorganized territory just north of Schuyler was formed into McDonough County; however, it did not yet have an organized government and remained attached to Schuyler.
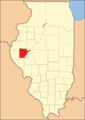 Schuyler between 1830 and 1839, after the detachment of McDonough County.
 Schuyler in 1839, when the creation of Brown County reduced Schuyler to its present borders.
Geography
According to the U.S. Census Bureau, the county has a total area of 441 square miles (1,140 km2), of which 437 square miles (1,130 km2) is land and 4.1 square miles (11 km2) (0.9%) is water.[4]
Climate and weather
| Rushville, Illinois | ||||||||||||||||||||||||||||||||||||||||||||||||||||||||||||
|---|---|---|---|---|---|---|---|---|---|---|---|---|---|---|---|---|---|---|---|---|---|---|---|---|---|---|---|---|---|---|---|---|---|---|---|---|---|---|---|---|---|---|---|---|---|---|---|---|---|---|---|---|---|---|---|---|---|---|---|---|
| Climate chart (explanation) | ||||||||||||||||||||||||||||||||||||||||||||||||||||||||||||
| ||||||||||||||||||||||||||||||||||||||||||||||||||||||||||||
| ||||||||||||||||||||||||||||||||||||||||||||||||||||||||||||
In recent years, average temperatures in the county seat of Rushville have ranged from a low of 15 °F (−9 °C) in January to a high of 87 °F (31 °C) in July, although a record low of −26 °F (−32 °C) was recorded in February 1905 and a record high of 113 °F (45 °C) was recorded in July 1936. Average monthly precipitation ranged from 1.55 inches (39 mm) in January to 5.14 inches (131 mm) in May.[5]
Major highways
Adjacent counties
- McDonough County (north)
- Fulton County (northeast)
- Mason County (east)
- Cass County (southeast)
- Brown County (south)
- Adams County (southwest)
- Hancock County (northwest)
Demographics
| Historical population | |||
|---|---|---|---|
| Census | Pop. | %± | |
| 1840 | 6,972 | — | |
| 1850 | 10,573 | 51.6% | |
| 1860 | 14,684 | 38.9% | |
| 1870 | 17,419 | 18.6% | |
| 1880 | 16,249 | −6.7% | |
| 1890 | 16,013 | −1.5% | |
| 1900 | 16,129 | 0.7% | |
| 1910 | 14,852 | −7.9% | |
| 1920 | 13,285 | −10.6% | |
| 1930 | 11,676 | −12.1% | |
| 1940 | 11,430 | −2.1% | |
| 1950 | 9,613 | −15.9% | |
| 1960 | 8,746 | −9.0% | |
| 1970 | 8,135 | −7.0% | |
| 1980 | 8,365 | 2.8% | |
| 1990 | 7,498 | −10.4% | |
| 2000 | 7,189 | −4.1% | |
| 2010 | 7,544 | 4.9% | |
| Est. 2016 | 6,923 | [6] | −8.2% |
| U.S. Decennial Census[7] 1790-1960[8] 1900-1990[9] 1990-2000[10] 2010-2013[1] | |||
As of the 2010 United States Census, there were 7,544 people, 3,040 households, and 2,014 families residing in the county.[11] The population density was 17.3 inhabitants per square mile (6.7/km2). There were 3,459 housing units at an average density of 7.9 per square mile (3.1/km2).[4] The racial makeup of the county was 95.5% white, 3.2% black or African American, 0.2% American Indian, 0.1% Asian, 0.5% from other races, and 0.5% from two or more races. Those of Hispanic or Latino origin made up 1.2% of the population.[11] In terms of ancestry, 26.8% were American, 20.2% were German, 13.1% were English, and 12.0% were Irish.[12]
Of the 3,040 households, 28.2% had children under the age of 18 living with them, 53.5% were married couples living together, 7.6% had a female householder with no husband present, 33.8% were non-families, and 28.6% of all households were made up of individuals. The average household size was 2.33 and the average family size was 2.83. The median age was 43.6 years.[11]
The median income for a household in the county was $43,686 and the median income for a family was $51,654. Males had a median income of $40,998 versus $28,810 for females. The per capita income for the county was $20,649. About 8.6% of families and 14.0% of the population were below the poverty line, including 16.8% of those under age 18 and 14.1% of those age 65 or over.[13]
Politics
Schuyler County is located in Illinois's 18th Congressional District and is currently represented by Republican Darin LaHood. For the Illinois House of Representatives, the county is located in the 93rd district and is currently represented by Republican Norine Hammond. The county is located in the 47th district of the Illinois Senate, and is currently represented by Republican Jil Tracy.
In presidential elections, Schuyler County usually favors Republican candidates, having voted for Democratic presidential candidates in only four elections during the period of 1944-2016. Since 1944, the Democratic candidate has won a majority of the vote in Schuyler County only once (in 1964).
| Year | Republican | Democratic | Third Parties |
|---|---|---|---|
| 2016 | 65.8% 2,524 | 28.0% 1,075 | 6.1% 235 |
| 2012 | 53.0% 2,069 | 44.3% 1,727 | 2.7% 106 |
| 2008 | 47.8% 1,833 | 49.5% 1,900 | 2.8% 106 |
| 2004 | 59.6% 2,403 | 39.5% 1,594 | 0.8% 34 |
| 2000 | 55.1% 2,077 | 42.1% 1,587 | 2.9% 108 |
| 1996 | 42.6% 1,597 | 43.6% 1,636 | 13.8% 516 |
| 1992 | 37.9% 1,512 | 41.3% 1,650 | 20.9% 833 |
| 1988 | 53.6% 2,178 | 45.9% 1,866 | 0.5% 22 |
| 1984 | 61.9% 2,515 | 37.8% 1,533 | 0.3% 13 |
| 1980 | 62.8% 2,799 | 32.4% 1,445 | 4.9% 216 |
| 1976 | 56.4% 2,635 | 43.1% 2,014 | 0.4% 20 |
| 1972 | 66.0% 2,994 | 33.8% 1,534 | 0.1% 6 |
| 1968 | 60.0% 2,760 | 32.1% 1,475 | 7.9% 365 |
| 1964 | 49.1% 2,417 | 50.9% 2,504 | 0.0% 0 |
| 1960 | 59.0% 3,047 | 41.0% 2,115 | 0.0% 2 |
| 1956 | 58.2% 3,068 | 41.5% 2,189 | 0.3% 13 |
| 1952 | 61.3% 3,295 | 38.6% 2,076 | 0.1% 4 |
| 1948 | 49.7% 2,519 | 48.6% 2,464 | 1.8% 91 |
| 1944 | 51.8% 2,801 | 47.3% 2,555 | 0.9% 49 |
| 1940 | 48.8% 3,318 | 50.0% 3,404 | 1.2% 81 |
| 1936 | 43.5% 3,029 | 55.8% 3,885 | 0.6% 43 |
| 1932 | 35.0% 2,075 | 63.8% 3,782 | 1.2% 73 |
| 1928 | 54.0% 3,011 | 45.6% 2,542 | 0.4% 23 |
| 1924 | 46.2% 2,729 | 48.4% 2,860 | 5.4% 317 |
| 1920 | 53.9% 2,800 | 43.4% 2,258 | 2.7% 141 |
| 1916 | 41.6% 2,595 | 54.3% 3,392 | 4.1% 255 |
| 1912 | 20.3% 694 | 50.0% 1,714 | 29.8% 1,020 |
| 1908 | 43.3% 1,622 | 50.1% 1,876 | 6.6% 247 |
| 1904 | 45.3% 1,636 | 46.6% 1,682 | 8.2% 295 |
| 1900 | 44.2% 1,791 | 53.5% 2,167 | 2.3% 92 |
| 1896 | 43.4% 1,848 | 54.8% 2,334 | 1.9% 79 |
| 1892 | 41.2% 1,563 | 49.6% 1,880 | 9.3% 351 |
Communities
City
Villages
Unincorporated communities
- Bader
- Bluff City
- Birmingham
- Brooklyn
- Doddsville
- Frederick
- Huntsville
- Layton
- Neelys
- Pleasant View
- Ray
- Sheldons Grove
Townships
Schuyler County is divided into these townships:
See also
References
- 1 2 "State & County QuickFacts". United States Census Bureau. Retrieved July 8, 2014.
- ↑ "Find a County". National Association of Counties. Retrieved 2011-06-07.
- ↑ White, Jesse. Origin and Evolution of Illinois Counties. State of Illinois, March 2010.
- 1 2 "Population, Housing Units, Area, and Density: 2010 - County". United States Census Bureau. Retrieved 2015-07-12.
- 1 2 "Monthly Averages for Rushville, Illinois". The Weather Channel. Retrieved 2011-01-27.
- ↑ "Population and Housing Unit Estimates". Retrieved June 9, 2017.
- ↑ "U.S. Decennial Census". United States Census Bureau. Retrieved July 8, 2014.
- ↑ "Historical Census Browser". University of Virginia Library. Retrieved July 8, 2014.
- ↑ "Population of Counties by Decennial Census: 1900 to 1990". United States Census Bureau. Retrieved July 8, 2014.
- ↑ "Census 2000 PHC-T-4. Ranking Tables for Counties: 1990 and 2000" (PDF). United States Census Bureau. Retrieved July 8, 2014.
- 1 2 3 "DP-1 Profile of General Population and Housing Characteristics: 2010 Demographic Profile Data". United States Census Bureau. Retrieved 2015-07-12.
- ↑ "DP02 SELECTED SOCIAL CHARACTERISTICS IN THE UNITED STATES – 2006-2010 American Community Survey 5-Year Estimates". United States Census Bureau. Retrieved 2015-07-12.
- ↑ "DP03 SELECTED ECONOMIC CHARACTERISTICS – 2006-2010 American Community Survey 5-Year Estimates". United States Census Bureau. Retrieved 2015-07-12.
- ↑ http://uselectionatlas.org/RESULTS
External links
Places adjacent to Schuyler County, Illinois | ||||||||||
|---|---|---|---|---|---|---|---|---|---|---|
| ||||||||||
Municipalities and communities of Schuyler County, Illinois, United States | ||
|---|---|---|
| City | ||
| Villages | ||
| Townships | ||
| Unincorporated communities | ||
