Clark County, Illinois
| Clark County, Illinois | |
|---|---|
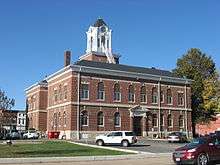 Clark County Courthouse in Marshall | |
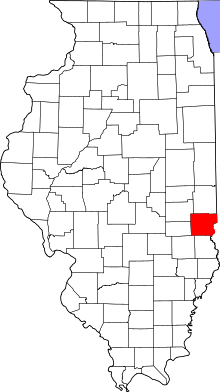 Location in the U.S. state of Illinois | |
 Illinois's location in the U.S. | |
| Founded | 1819 |
| Named for | George Rogers Clark |
| Seat | Marshall |
| Largest city | Marshall |
| Area | |
| • Total | 505 sq mi (1,308 km2) |
| • Land | 501 sq mi (1,298 km2) |
| • Water | 3.4 sq mi (9 km2), 0.7% |
| Population | |
| • (2010) | 16,335 |
| • Density | 33/sq mi (13/km2) |
| Congressional district | 15th |
| Time zone | Eastern: UTC−5/−4 |
| Website |
www |
Clark County is a county located in the southeastern part of U.S. state of Illinois, along the Indiana state line. As of the 2010 census, the population was 16,335.[1] Its county seat is Marshall.[2] The county was named for George Rogers Clark, an officer who served in the American Revolution.[3]
History
Clark County was formed in 1819 out of Crawford County. At the time of its formation, Clark County included about a third of Illinois, and extended as far north as the present state of Wisconsin. In 1821 the northern part of Clark County became part of the newly created Pike County on January 31, and the newly created Fayette County took the western part of Clark County on February 14. Edgar County was created from the northern part of Clark County on January 3, 1823. The creation of Coles County occupied additional land from western Clark County, effective December 25, 1830.[4] The boundaries of Clark County have been unchanged since.
Clark County was named for George Rogers Clark[5] (older brother of William Clark of the Lewis and Clark Expedition), an officer of the army of Virginia that captured the Northwest Territory from the British during the Revolutionary War.
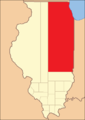 Clark County from the time of its creation to 1821
 Clark between 1821 and 1823
 Clark between 1823 and 1830
 Clark reduced to its current size in 1830 by the creation of Coles County
The county seat was located in Darwin Township in 1823. A county-wide election was held In 1839 to determine whether Auburn or Marshall would be designated as the new seat. Marshall won the election and has remained the county seat since then.[6]
Geography
According to the U.S. Census Bureau, the county has a total area of 505 square miles (1,310 km2), of which 501 square miles (1,300 km2) is land and 3.4 square miles (8.8 km2) (0.7%) is water.[7] Part of the county's eastern border is defined by the Wabash River. The North Fork of the Embarras River and Hurricane Creek are the main streams in western Clark County. Other than the Wabash River, Big Creek is the major stream in the eastern part of the county.[8]
Adjacent counties
- Edgar County - north
- Vigo County, Indiana - northeast
- Sullivan County, Indiana - southeast
- Crawford County - south
- Jasper County - southwest
- Cumberland County - west
- Coles County - northwest
Major highways
Climate and weather
| Marshall, Illinois | ||||||||||||||||||||||||||||||||||||||||||||||||||||||||||||
|---|---|---|---|---|---|---|---|---|---|---|---|---|---|---|---|---|---|---|---|---|---|---|---|---|---|---|---|---|---|---|---|---|---|---|---|---|---|---|---|---|---|---|---|---|---|---|---|---|---|---|---|---|---|---|---|---|---|---|---|---|
| Climate chart (explanation) | ||||||||||||||||||||||||||||||||||||||||||||||||||||||||||||
| ||||||||||||||||||||||||||||||||||||||||||||||||||||||||||||
| ||||||||||||||||||||||||||||||||||||||||||||||||||||||||||||
In recent years, average temperatures in the county seat of Marshall have ranged from a low of 16 °F (−9 °C) in January to a high of 86 °F (30 °C) in July, although a record low of −23 °F (−31 °C) was recorded in January 1930 and a record high of 109 °F (43 °C) was recorded in July 1936. Average monthly precipitation ranged from 2.23 inches (57 mm) in January to 4.43 inches (113 mm) in July.[9]
Demographics
| Historical population | |||
|---|---|---|---|
| Census | Pop. | %± | |
| 1820 | 931 | — | |
| 1830 | 3,940 | 323.2% | |
| 1840 | 7,453 | 89.2% | |
| 1850 | 9,532 | 27.9% | |
| 1860 | 14,987 | 57.2% | |
| 1870 | 18,709 | 24.8% | |
| 1880 | 21,894 | 17.0% | |
| 1890 | 21,899 | 0.0% | |
| 1900 | 24,033 | 9.7% | |
| 1910 | 23,517 | −2.1% | |
| 1920 | 21,165 | −10.0% | |
| 1930 | 17,872 | −15.6% | |
| 1940 | 18,842 | 5.4% | |
| 1950 | 17,362 | −7.9% | |
| 1960 | 16,546 | −4.7% | |
| 1970 | 16,216 | −2.0% | |
| 1980 | 16,913 | 4.3% | |
| 1990 | 15,921 | −5.9% | |
| 2000 | 17,008 | 6.8% | |
| 2010 | 16,335 | −4.0% | |
| Est. 2016 | 15,938 | [10] | −2.4% |
| U.S. Decennial Census[11] 1790-1960[12] 1900-1990[13] 1990-2000[14] 2010-2013[1] | |||
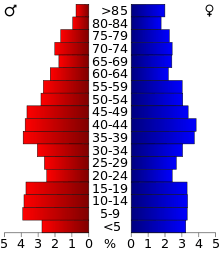
As of the 2010 United States Census, there were 16,335 people, 6,782 households, and 4,593 families residing in the county.[15] The population density was 32.6 inhabitants per square mile (12.6/km2). There were 7,772 housing units at an average density of 15.5 per square mile (6.0/km2).[7] The racial makeup of the county was 98.1% white, 0.3% black or African American, 0.3% Asian, 0.2% American Indian, 0.3% from other races, and 0.7% from two or more races. Those of Hispanic or Latino origin made up 1.1% of the population.[15] In terms of ancestry, 27.4% were German, 14.2% were Irish, 14.2% were English, and 10.8% were American.[16]
Of the 6,782 households, 30.3% had children under the age of 18 living with them, 53.5% were married couples living together, 9.7% had a female householder with no husband present, 32.3% were non-families, and 27.7% of all households were made up of individuals. The average household size was 2.38 and the average family size was 2.87. The median age was 42.3 years.[15]
The median income for a household in the county was $43,597 and the median income for a family was $52,689. Males had a median income of $39,385 versus $27,426 for females. The per capita income for the county was $23,173. About 7.6% of families and 10.9% of the population were below the poverty line, including 15.3% of those under age 18 and 9.8% of those age 65 or over.[17]
Education
There are three school districts in Clark County (Marshall, Martinsville and Casey-Westfield) with a total enrollment (2004) of 3,014 students. Each district has one high school (grades 9-12) and one junior high school (grades 7-8). Marshall has two elementary schools and the other districts have one each.
Communities
Cities
Village
Unincorporated communities
Townships
Clark County is divided into fifteen townships:
Politics
| Year | Republican | Democratic | Third Parties |
|---|---|---|---|
| 2016 | 70.9% 5,622 | 23.7% 1,877 | 5.4% 429 |
| 2012 | 65.2% 5,144 | 32.9% 2,591 | 1.9% 151 |
| 2008 | 53.0% 4,409 | 45.0% 3,742 | 1.9% 161 |
| 2004 | 63.5% 5,082 | 35.9% 2,877 | 0.6% 48 |
| 2000 | 58.6% 4,398 | 39.0% 2,932 | 2.4% 182 |
| 1996 | 47.2% 3,409 | 41.5% 2,995 | 11.3% 816 |
| 1992 | 39.8% 3,175 | 41.8% 3,338 | 18.4% 1,466 |
| 1988 | 57.7% 4,508 | 41.9% 3,275 | 0.4% 28 |
| 1984 | 63.5% 5,318 | 36.2% 3,032 | 0.4% 32 |
| 1980 | 63.2% 5,476 | 32.9% 2,855 | 3.9% 335 |
| 1976 | 52.3% 4,506 | 47.2% 4,071 | 0.5% 45 |
| 1972 | 65.7% 5,706 | 34.2% 2,965 | 0.1% 9 |
| 1968 | 56.1% 4,809 | 32.8% 2,813 | 11.1% 953 |
| 1964 | 49.7% 4,403 | 50.3% 4,464 | |
| 1960 | 57.4% 5,319 | 42.6% 3,949 | 0.1% 5 |
| 1956 | 60.7% 5,451 | 39.2% 3,519 | 0.0% 4 |
| 1952 | 61.1% 5,700 | 38.8% 3,621 | 0.1% 5 |
| 1948 | 53.9% 4,477 | 44.7% 3,714 | 1.4% 112 |
| 1944 | 59.4% 5,373 | 40.0% 3,619 | 0.6% 52 |
| 1940 | 55.2% 5,976 | 44.4% 4,807 | 0.5% 53 |
| 1936 | 48.0% 5,426 | 51.6% 5,836 | 0.5% 52 |
| 1932 | 42.0% 4,148 | 57.3% 5,659 | 0.8% 74 |
| 1928 | 60.6% 5,632 | 39.0% 3,621 | 0.4% 35 |
| 1924 | 51.6% 4,731 | 45.8% 4,203 | 2.7% 244 |
| 1920 | 55.4% 5,312 | 43.6% 4,181 | 1.1% 104 |
| 1916 | 47.3% 4,936 | 50.8% 5,311 | 1.9% 199 |
| 1912 | 34.2% 1,897 | 45.3% 2,517 | 20.5% 1,138 |
| 1908 | 51.3% 3,158 | 45.3% 2,793 | 3.4% 210 |
| 1904 | 52.7% 2,886 | 41.5% 2,271 | 5.8% 319 |
| 1900 | 47.8% 2,929 | 49.1% 3,009 | 3.1% 192 |
| 1896 | 47.7% 2,888 | 51.2% 3,103 | 1.1% 69 |
| 1892 | 41.9% 2,181 | 43.1% 2,244 | 15.0% 783 |
In its early days Clark County favoured the Democratic Party, not supporting a Republican presidential candidate until Theodore Roosevelt’s 1904 landslide. Since 1920 it has been a strongly Republican county: the last Democrat to win a majority being Lyndon Johnson in 1964, and only Bill Clinton by plurality in 1992 has won the county since.
See also
Sources
- Perrin, William Henry, ed.. History of Crawford and Clark Counties, Illinois Chicago, Illinois. O. L. Baskin & Co. (1883).
References
- Specific
- 1 2 "State & County QuickFacts". United States Census Bureau. Retrieved July 4, 2014.
- ↑ "Find a County". National Association of Counties. Archived from the original on 2011-05-31. Retrieved 2011-06-07.
- ↑ Perrin, p. 237
- ↑ "Illinois County Boundaries 1790 - Present." Hebert, Michael H. Retrieved June 17, 2014.
- ↑ Gannett, Henry (1905). The Origin of Certain Place Names in the United States. Govt. Print. Off. p. 82.
- ↑ "Welcome to Clark County, Illinois, Genealogy and History." Retrieved June 10, 2014.
- 1 2 "Population, Housing Units, Area, and Density: 2010 - County". United States Census Bureau. Retrieved 2015-07-11.
- ↑ Perrin, p.210.
- 1 2 "Monthly Averages for Marshall, Illinois". The Weather Channel. Retrieved 2011-01-27.
- ↑ "Population and Housing Unit Estimates". Retrieved June 9, 2017.
- ↑ "U.S. Decennial Census". United States Census Bureau. Archived from the original on May 12, 2015. Retrieved July 4, 2014.
- ↑ "Historical Census Browser". University of Virginia Library. Retrieved July 4, 2014.
- ↑ "Population of Counties by Decennial Census: 1900 to 1990". United States Census Bureau. Retrieved July 4, 2014.
- ↑ "Census 2000 PHC-T-4. Ranking Tables for Counties: 1990 and 2000" (PDF). United States Census Bureau. Retrieved July 4, 2014.
- 1 2 3 "DP-1 Profile of General Population and Housing Characteristics: 2010 Demographic Profile Data". United States Census Bureau. Retrieved 2015-07-11.
- ↑ "DP02 SELECTED SOCIAL CHARACTERISTICS IN THE UNITED STATES – 2006-2010 American Community Survey 5-Year Estimates". United States Census Bureau. Retrieved 2015-07-11.
- ↑ "DP03 SELECTED ECONOMIC CHARACTERISTICS – 2006-2010 American Community Survey 5-Year Estimates". United States Census Bureau. Retrieved 2015-07-11.
- ↑ http://uselectionatlas.org/RESULTS
- General
External links
- Clark County, Illinois History and Genealogy

Places adjacent to Clark County, Illinois | ||||||||||
|---|---|---|---|---|---|---|---|---|---|---|
| ||||||||||
Municipalities and communities of Clark County, Illinois, United States | ||
|---|---|---|
| Cities | ||
| Town | ||
| Townships | ||
| CDP | ||
| Unincorporated communities | ||
| Ghost town | ||
| Footnotes | ‡This populated place also has portions in an adjacent county or counties | |
