United States presidential election in Kansas, 1992
|
| |||||||||||||||||||||||||||||||||
| |||||||||||||||||||||||||||||||||
| |||||||||||||||||||||||||||||||||
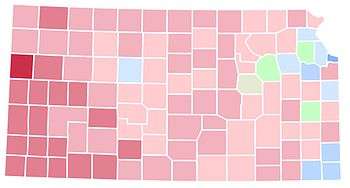 County Results
Clinton—50-60%
Clinton—40-50%
Bush—40-50%
Bush—50-60%
Bush—60-70%
Tie (Perot-Bush)—<40%
Perot—40-50% | |||||||||||||||||||||||||||||||||
| |||||||||||||||||||||||||||||||||

| Elections in Kansas | ||||||||||
|---|---|---|---|---|---|---|---|---|---|---|
 | ||||||||||
|
||||||||||
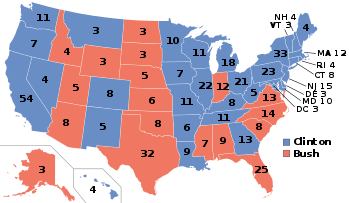
The 1992 United States presidential election in Kansas took place on November 3, 1992, as part of the 1992 United States presidential election. Voters chose six representatives, or electors to the Electoral College, who voted for president and vice president.
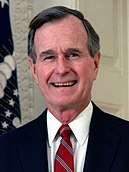
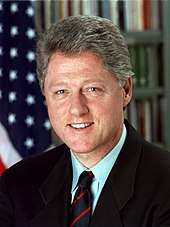
Kansas was won by incumbent President George H.W. Bush (R-Texas) with 38.88% of the popular vote over Governor Bill Clinton (D-Arkansas) with 33.74%. Businessman Ross Perot (I-Texas) finished in third, with 26.99% of the popular vote. Kansas was surprisingly close, likely because Ross Perot split the vote. Had Clinton won in Kansas, it would have been a major upset victory.[1] Clinton ultimately won the national vote, defeating incumbent President Bush and Perot.[2] As of the 2016 presidential election, this is the last election in which Ellis County, Cherokee County, Leavenworth County, Shawnee County, Labette County, and Miami County voted for a Democratic presidential candidate,[3] as well as the last election in which Wabaunsee County, Anderson County, Jefferson County, and Morris County did not support the Republican candidate.[3]
With 29.99% of the popular vote, Kansas would prove to be Perot's fifth strongest state after Maine, Alaska, Utah and Idaho[4].
Results
| United States presidential election in Kansas, 1992[1] | |||||
|---|---|---|---|---|---|
| Party | Candidate | Votes | Percentage | Electoral votes | |
| Republican | George H.W. Bush (incumbent) | 449,951 | 38.88% | 6 | |
| Democratic | Bill Clinton | 390,434 | 33.74% | 0 | |
| Independent | Ross Perot | 312,358 | 26.99% | 0 | |
| Libertarian | Andre Marrou | 4,314 | 0.37% | 0 | |
| N/A | Other | 199 | 0.02% | 0 | |
| Totals | 1,157,256 | 100.0% | 6 | ||
Results by county
| George Herbert Walker Bush Republican |
William Jefferson Clinton Democratic |
Henry Ross Perot Independent |
Various candidates Other parties |
Margin | Total votes cast | ||||||
|---|---|---|---|---|---|---|---|---|---|---|---|
| County | # | % | # | % | # | % | # | % | # | % | # |
| Allen | 2,351 | 36.56% | 2,312 | 35.96% | 1,746 | 27.15% | 21 | 0.33% | 39 | 0.61% | 6,430 |
| Anderson | 1,218 | 33.03% | 1,178 | 31.95% | 1,282 | 34.77% | 9 | 0.24% | -64[lower-alpha 1] | -1.74% | 3,687 |
| Atchison | 2,521 | 33.48% | 2,959 | 39.30% | 2,020 | 26.83% | 30 | 0.40% | -438 | -5.82% | 7,530 |
| Barber | 1,225 | 42.52% | 759 | 26.35% | 893 | 31.00% | 4 | 0.14% | 332[lower-alpha 1] | 11.52% | 2,881 |
| Barton | 5,113 | 37.65% | 3,846 | 28.32% | 4,574 | 33.68% | 49 | 0.36% | 539[lower-alpha 1] | 3.97% | 13,582 |
| Bourbon | 2,876 | 40.17% | 2,509 | 35.05% | 1,763 | 24.63% | 11 | 0.15% | 367 | 5.13% | 7,159 |
| Brown | 2,203 | 41.61% | 1,476 | 27.88% | 1,603 | 30.28% | 12 | 0.23% | 600[lower-alpha 1] | 11.33% | 5,294 |
| Butler | 9,166 | 38.79% | 7,029 | 29.75% | 7,355 | 31.13% | 79 | 0.33% | 1,811[lower-alpha 1] | 7.66% | 23,629 |
| Chase | 610 | 36.20% | 470 | 27.89% | 600 | 35.61% | 5 | 0.30% | 10[lower-alpha 1] | 0.59% | 1,685 |
| Chautauqua | 853 | 41.15% | 598 | 28.85% | 607 | 29.28% | 15 | 0.72% | 246[lower-alpha 1] | 11.87% | 2,073 |
| Cherokee | 3,589 | 36.78% | 4,083 | 41.85% | 2,067 | 21.18% | 18 | 0.18% | -494 | -5.06% | 9,757 |
| Cheyenne | 863 | 49.17% | 407 | 23.19% | 477 | 27.18% | 8 | 0.46% | 386[lower-alpha 1] | 21.99% | 1,755 |
| Clark | 676 | 51.49% | 293 | 22.32% | 341 | 25.97% | 3 | 0.23% | 335[lower-alpha 1] | 25.51% | 1,313 |
| Clay | 2,198 | 47.89% | 947 | 20.63% | 1,434 | 31.24% | 11 | 0.24% | 764[lower-alpha 1] | 16.64% | 4,590 |
| Cloud | 2,131 | 39.12% | 1,720 | 31.57% | 1,578 | 28.96% | 19 | 0.35% | 411 | 7.54% | 5,448 |
| Coffey | 1,824 | 42.44% | 1,021 | 23.76% | 1,443 | 33.57% | 10 | 0.23% | 381[lower-alpha 1] | 8.86% | 4,298 |
| Comanche | 636 | 49.49% | 325 | 25.29% | 324 | 25.21% | 0 | 0.00% | 311 | 24.20% | 1,285 |
| Cowley | 5,422 | 34.35% | 5,405 | 34.24% | 4,911 | 31.11% | 46 | 0.29% | 17 | 0.11% | 15,784 |
| Crawford | 5,468 | 32.96% | 7,366 | 44.40% | 3,706 | 22.34% | 51 | 0.31% | -1,898 | -11.44% | 16,591 |
| Decatur | 940 | 45.00% | 576 | 27.57% | 565 | 27.05% | 8 | 0.38% | 364 | 17.42% | 2,089 |
| Dickinson | 3,851 | 41.76% | 2,518 | 27.31% | 2,833 | 30.72% | 19 | 0.21% | 1,018[lower-alpha 1] | 11.04% | 9,221 |
| Doniphan | 1,579 | 39.74% | 1,177 | 29.62% | 1,200 | 30.20% | 17 | 0.43% | 379[lower-alpha 1] | 9.54% | 3,973 |
| Douglas | 12,949 | 30.64% | 19,439 | 45.99% | 9,630 | 22.78% | 247 | 0.58% | -6,490 | -15.36% | 42,265 |
| Edwards | 769 | 39.95% | 567 | 29.45% | 584 | 30.34% | 5 | 0.26% | 185[lower-alpha 1] | 9.61% | 1,925 |
| Elk | 748 | 42.94% | 485 | 27.84% | 503 | 28.87% | 6 | 0.34% | 245[lower-alpha 1] | 14.06% | 1,742 |
| Ellis | 3,985 | 32.00% | 4,544 | 36.49% | 3,887 | 31.21% | 37 | 0.30% | -559 | -4.49% | 12,453 |
| Ellsworth | 1,197 | 36.96% | 1,010 | 31.18% | 1,020 | 31.49% | 12 | 0.37% | 177[lower-alpha 1] | 5.46% | 3,239 |
| Finney | 5,278 | 48.28% | 2,612 | 23.89% | 3,011 | 27.54% | 32 | 0.29% | 2,267[lower-alpha 1] | 20.74% | 10,933 |
| Ford | 4,342 | 41.93% | 2,635 | 25.44% | 3,341 | 32.26% | 38 | 0.37% | 1,001[lower-alpha 1] | 9.67% | 10,356 |
| Franklin | 3,699 | 37.43% | 2,968 | 30.03% | 3,184 | 32.22% | 32 | 0.32% | 515[lower-alpha 1] | 5.21% | 9,883 |
| Geary | 2,928 | 38.75% | 2,559 | 33.87% | 2,057 | 27.22% | 12 | 0.16% | 369 | 4.88% | 7,556 |
| Gove | 792 | 46.42% | 379 | 22.22% | 532 | 31.18% | 3 | 0.18% | 260[lower-alpha 1] | 15.24% | 1,706 |
| Graham | 752 | 39.33% | 554 | 28.97% | 603 | 31.54% | 3 | 0.16% | 149[lower-alpha 1] | 7.79% | 1,912 |
| Grant | 1,561 | 51.71% | 619 | 20.50% | 835 | 27.66% | 4 | 0.13% | 726[lower-alpha 1] | 24.05% | 3,019 |
| Gray | 1,039 | 47.81% | 443 | 20.39% | 686 | 31.57% | 5 | 0.23% | 353[lower-alpha 1] | 16.24% | 2,173 |
| Greeley | 504 | 57.73% | 191 | 21.88% | 175 | 20.05% | 3 | 0.34% | 313 | 35.85% | 873 |
| Greenwood | 1,411 | 36.62% | 1,262 | 32.75% | 1,167 | 30.29% | 13 | 0.34% | 149 | 3.87% | 3,853 |
| Hamilton | 716 | 51.96% | 386 | 28.01% | 271 | 19.67% | 5 | 0.36% | 330 | 23.95% | 1,378 |
| Harper | 1,371 | 40.59% | 845 | 25.01% | 1,151 | 34.07% | 11 | 0.33% | 220[lower-alpha 1] | 6.51% | 3,378 |
| Harvey | 6,259 | 41.71% | 5,047 | 33.63% | 3,653 | 24.34% | 47 | 0.31% | 1,212 | 8.08% | 15,006 |
| Haskell | 1,023 | 56.02% | 336 | 18.40% | 462 | 25.30% | 5 | 0.27% | 561[lower-alpha 1] | 30.72% | 1,826 |
| Hodgeman | 625 | 50.85% | 258 | 20.99% | 343 | 27.91% | 3 | 0.24% | 282[lower-alpha 1] | 22.95% | 1,229 |
| Jackson | 1,970 | 35.48% | 1,639 | 29.52% | 1,927 | 34.71% | 16 | 0.29% | 43[lower-alpha 1] | 0.77% | 5,552 |
| Jefferson | 2,569 | 33.02% | 2,538 | 32.62% | 2,642 | 33.96% | 31 | 0.40% | -73[lower-alpha 1] | -0.94% | 7,780 |
| Jewell | 1,050 | 45.65% | 546 | 23.74% | 698 | 30.35% | 6 | 0.26% | 352[lower-alpha 1] | 15.30% | 2,300 |
| Johnson | 85,418 | 43.83% | 59,573 | 30.57% | 49,136 | 25.22% | 739 | 0.38% | 25,845 | 13.26% | 194,866 |
| Kearny | 943 | 55.18% | 384 | 22.47% | 376 | 22.00% | 6 | 0.35% | 559 | 32.71% | 1,709 |
| Kingman | 1,680 | 40.36% | 1,100 | 26.42% | 1,370 | 32.91% | 13 | 0.31% | 310[lower-alpha 1] | 7.45% | 4,163 |
| Kiowa | 1,057 | 55.90% | 355 | 18.77% | 475 | 25.12% | 4 | 0.21% | 582[lower-alpha 1] | 30.78% | 1,891 |
| Labette | 3,368 | 33.09% | 4,196 | 41.23% | 2,577 | 25.32% | 36 | 0.35% | -828 | -8.14% | 10,177 |
| Lane | 674 | 51.89% | 265 | 20.40% | 356 | 27.41% | 4 | 0.31% | 318[lower-alpha 1] | 24.48% | 1,299 |
| Leavenworth | 7,738 | 33.39% | 8,077 | 34.86% | 7,306 | 31.53% | 51 | 0.22% | -339 | -1.46% | 23,172 |
| Lincoln | 893 | 41.11% | 612 | 28.18% | 657 | 30.25% | 10 | 0.46% | 236[lower-alpha 1] | 10.87% | 2,172 |
| Linn | 1,413 | 34.20% | 1,353 | 32.75% | 1,358 | 32.87% | 7 | 0.17% | 55[lower-alpha 1] | 1.33% | 4,131 |
| Logan | 905 | 52.95% | 355 | 20.77% | 446 | 26.10% | 3 | 0.18% | 459[lower-alpha 1] | 26.86% | 1,709 |
| Lyon | 5,090 | 34.73% | 4,811 | 32.83% | 4,717 | 32.18% | 38 | 0.26% | 279 | 1.90% | 14,656 |
| McPherson | 5,745 | 44.22% | 3,645 | 28.06% | 3,561 | 27.41% | 40 | 0.31% | 2,100 | 16.17% | 12,991 |
| Marion | 3,142 | 49.47% | 1,627 | 25.62% | 1,557 | 24.52% | 25 | 0.39% | 1,515 | 23.85% | 6,351 |
| Marshall | 2,030 | 34.65% | 2,022 | 34.52% | 1,786 | 30.49% | 20 | 0.34% | 8 | 0.14% | 5,858 |
| Meade | 1,135 | 52.45% | 430 | 19.87% | 592 | 27.36% | 7 | 0.32% | 543[lower-alpha 1] | 25.09% | 2,164 |
| Miami | 3,528 | 31.80% | 3,835 | 34.56% | 3,701 | 33.35% | 32 | 0.29% | 134[lower-alpha 2] | 1.21% | 11,096 |
| Mitchell | 1,601 | 43.86% | 938 | 25.70% | 1,098 | 30.08% | 13 | 0.36% | 503[lower-alpha 1] | 13.78% | 3,650 |
| Montgomery | 6,848 | 43.04% | 5,453 | 34.27% | 3,570 | 22.44% | 41 | 0.26% | 1,395 | 8.77% | 15,912 |
| Morris | 1,071 | 34.43% | 957 | 30.76% | 1,071 | 34.43% | 12 | 0.39% | 0[lower-alpha 1] | 0.00% | 3,111 |
| Morton | 915 | 54.79% | 398 | 23.83% | 350 | 20.96% | 7 | 0.42% | 517 | 30.96% | 1,670 |
| Nemaha | 2,220 | 39.51% | 1,580 | 28.12% | 1,804 | 32.11% | 15 | 0.27% | 416[lower-alpha 1] | 7.40% | 5,619 |
| Neosho | 2,926 | 37.07% | 2,799 | 35.46% | 2,136 | 27.06% | 32 | 0.41% | 127 | 1.61% | 7,893 |
| Ness | 967 | 43.60% | 565 | 25.47% | 678 | 30.57% | 8 | 0.36% | 289[lower-alpha 1] | 13.03% | 2,218 |
| Norton | 1,469 | 47.88% | 779 | 25.39% | 815 | 26.56% | 5 | 0.16% | 654[lower-alpha 1] | 21.32% | 3,068 |
| Osage | 2,561 | 34.51% | 2,297 | 30.95% | 2,532 | 34.12% | 31 | 0.42% | 29[lower-alpha 1] | 0.39% | 7,421 |
| Osborne | 1,003 | 38.47% | 779 | 29.88% | 819 | 31.42% | 6 | 0.23% | 184[lower-alpha 1] | 7.06% | 2,607 |
| Ottawa | 1,284 | 45.53% | 764 | 27.09% | 762 | 27.02% | 10 | 0.35% | 520 | 18.44% | 2,820 |
| Pawnee | 1,357 | 37.85% | 1,118 | 31.19% | 1,097 | 30.60% | 13 | 0.36% | 239 | 6.67% | 3,585 |
| Phillips | 1,579 | 46.61% | 843 | 24.88% | 955 | 28.19% | 11 | 0.32% | 624[lower-alpha 1] | 18.42% | 3,388 |
| Pottawatomie | 3,106 | 38.87% | 2,099 | 26.27% | 2,759 | 34.53% | 26 | 0.33% | 347[lower-alpha 1] | 4.34% | 7,990 |
| Pratt | 1,779 | 37.17% | 1,466 | 30.63% | 1,528 | 31.93% | 13 | 0.27% | 251[lower-alpha 1] | 5.24% | 4,786 |
| Rawlins | 1,023 | 52.87% | 393 | 20.31% | 517 | 26.72% | 2 | 0.10% | 506[lower-alpha 1] | 26.15% | 1,935 |
| Reno | 11,377 | 40.10% | 9,257 | 32.63% | 7,636 | 26.91% | 102 | 0.36% | 2,120 | 7.47% | 28,372 |
| Republic | 1,767 | 46.43% | 939 | 24.67% | 1,084 | 28.48% | 16 | 0.42% | 683[lower-alpha 1] | 17.95% | 3,806 |
| Rice | 2,158 | 40.94% | 1,555 | 29.50% | 1,543 | 29.27% | 15 | 0.28% | 603 | 11.44% | 5,271 |
| Riley | 8,394 | 38.51% | 7,933 | 36.39% | 5,387 | 24.71% | 83 | 0.38% | 461 | 2.11% | 21,797 |
| Rooks | 1,249 | 40.42% | 771 | 24.95% | 1,063 | 34.40% | 7 | 0.23% | 186[lower-alpha 1] | 6.02% | 3,090 |
| Rush | 756 | 35.74% | 689 | 32.58% | 665 | 31.44% | 5 | 0.24% | 67 | 3.17% | 2,115 |
| Russell | 1,434 | 35.72% | 1,178 | 29.34% | 1,395 | 34.74% | 8 | 0.20% | 39[lower-alpha 1] | 0.97% | 4,015 |
| Saline | 8,565 | 36.26% | 7,890 | 33.40% | 7,108 | 30.09% | 60 | 0.25% | 675 | 2.86% | 23,623 |
| Scott | 1,426 | 56.27% | 480 | 18.94% | 621 | 24.51% | 7 | 0.28% | 805[lower-alpha 1] | 31.77% | 2,534 |
| Sedgwick | 75,577 | 40.53% | 62,670 | 33.61% | 47,238 | 25.33% | 990 | 0.53% | 12,907 | 6.92% | 186,475 |
| Seward | 3,477 | 51.09% | 1,488 | 21.86% | 1,818 | 26.71% | 23 | 0.34% | 1,659[lower-alpha 1] | 24.38% | 6,806 |
| Shawnee | 29,344 | 35.66% | 31,972 | 38.86% | 20,653 | 25.10% | 315 | 0.38% | -2,628 | -3.19% | 82,284 |
| Sheridan | 739 | 45.17% | 347 | 21.21% | 546 | 33.37% | 4 | 0.24% | 193[lower-alpha 1] | 11.80% | 1,636 |
| Sherman | 1,630 | 49.73% | 810 | 24.71% | 828 | 25.26% | 10 | 0.31% | 802[lower-alpha 1] | 24.47% | 3,278 |
| Smith | 1,236 | 43.34% | 789 | 27.66% | 816 | 28.61% | 11 | 0.39% | 420[lower-alpha 1] | 14.73% | 2,852 |
| Stafford | 1,064 | 38.55% | 777 | 28.15% | 910 | 32.97% | 9 | 0.33% | 154[lower-alpha 1] | 5.58% | 2,760 |
| Stanton | 556 | 55.71% | 224 | 22.44% | 214 | 21.44% | 4 | 0.40% | 332 | 33.27% | 998 |
| Stevens | 1,408 | 56.84% | 390 | 15.74% | 674 | 27.21% | 5 | 0.20% | 734[lower-alpha 1] | 29.63% | 2,477 |
| Sumner | 4,087 | 35.27% | 3,564 | 30.76% | 3,887 | 33.54% | 50 | 0.43% | 200[lower-alpha 1] | 1.73% | 11,588 |
| Thomas | 1,849 | 47.14% | 932 | 23.76% | 1,129 | 28.79% | 12 | 0.31% | 720[lower-alpha 1] | 18.36% | 3,922 |
| Trego | 727 | 38.02% | 608 | 31.80% | 574 | 30.02% | 3 | 0.16% | 119 | 6.22% | 1,912 |
| Wabaunsee | 1,254 | 37.17% | 851 | 25.22% | 1,258 | 37.29% | 11 | 0.33% | -4[lower-alpha 1] | -0.12% | 3,374 |
| Wallace | 679 | 63.70% | 164 | 15.38% | 219 | 20.54% | 4 | 0.38% | 460[lower-alpha 1] | 43.15% | 1,066 |
| Washington | 1,740 | 47.00% | 893 | 24.12% | 1,054 | 28.47% | 15 | 0.41% | 686[lower-alpha 1] | 18.53% | 3,702 |
| Wichita | 681 | 55.37% | 241 | 19.59% | 303 | 24.63% | 5 | 0.41% | 378[lower-alpha 1] | 30.73% | 1,230 |
| Wilson | 1,925 | 41.53% | 1,331 | 28.72% | 1,365 | 29.45% | 14 | 0.30% | 560[lower-alpha 1] | 12.08% | 4,635 |
| Woodson | 662 | 35.48% | 590 | 31.62% | 604 | 32.37% | 10 | 0.54% | 58[lower-alpha 1] | 3.11% | 1,866 |
| Wyandotte | 12,872 | 21.06% | 34,397 | 56.27% | 13,620 | 22.28% | 235 | 0.38% | 20,777[lower-alpha 2] | 33.99% | 61,124 |
| Totals | 449,951 | 38.89% | 390,434 | 33.74% | 312,358 | 27.00% | 4,334 | 0.37% | 59,517 | !5.14% | 1,157,077 |
Notes
- 1 2 3 4 5 6 7 8 9 10 11 12 13 14 15 16 17 18 19 20 21 22 23 24 25 26 27 28 29 30 31 32 33 34 35 36 37 38 39 40 41 42 43 44 45 46 47 48 49 50 51 52 53 54 55 56 57 58 59 60 61 62 63 64 65 In this county where Perot ran ahead of Clinton, margin given is Bush vote minus Perot vote and percentage margin Bush percentage minus Perot percentage.
- 1 2 In this county where Perot ran ahead of Bush, margin given in Clinton vote minus Perot vote and percentage margin Clinton percentage minus Perot percentage.
References
- 1 2 "1992 Presidential General Election Results - Kansas". U.S. Election Atlas. Retrieved 8 June 2012.
- ↑ "1992 Presidential General Election Results". U.S. Election Atlas. Retrieved 8 June 2012.
- 1 2 Sullivan, Robert David; ‘How the Red and Blue Map Evolved Over the Past Century’; America Magazine in The National Catholic Review; June 29, 2016
- ↑ "1992 Presidential Election Statistics". Dave Leip’s Atlas of U.S. Presidential Elections. Retrieved 2018-03-05.