Ness County, Kansas
| Ness County, Kansas | |
|---|---|
| County | |
 Ness County courthouse in Ness City | |
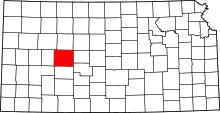 Location in the U.S. state of Kansas | |
 Kansas's location in the U.S. | |
| Founded | February 26, 1867 |
| Named for | Noah V. Ness |
| Seat | Ness City |
| Largest city | Ness City |
| Area | |
| • Total | 1,075 sq mi (2,784 km2) |
| • Land | 1,075 sq mi (2,784 km2) |
| • Water | 0.3 sq mi (1 km2), 0.02% |
| Population (est.) | |
| • (2016) | 2,962 |
| • Density | 2.9/sq mi (1.1/km2) |
| Congressional district | 1st |
| Time zone | Central: UTC−6/−5 |
| Website | NessCountyKS.com |
Ness County (standard abbreviation: NS) is a county located in the U.S. state of Kansas. As of the 2010 census, the county population was 3,107.[1] The largest city and county seat is Ness City.[2] The county was named for Corporal Noah V. Ness of the 7th Kansas Cavalry.[3]
History
Early history
For many millennia, the Great Plains of North America was inhabited by nomadic Native Americans. From the 16th century to 18th century, the Kingdom of France claimed ownership of large parts of North America. In 1762, after the French and Indian War, France secretly ceded New France to Spain, per the Treaty of Fontainebleau.
19th century
In 1802, Spain returned most of the land to France, but keeping title to about 7,500 square miles. In 1803, most of the land for modern day Kansas was acquired by the United States from France as part of the 828,000 square mile Louisiana Purchase for 2.83 cents per acre.
In 1854, the Kansas Territory was organized, then in 1861 Kansas became the 34th U.S. state. In 1867, Ness County was established.
Geography
According to the U.S. Census Bureau, the county has a total area of 1,075 square miles (2,780 km2), of which 1,075 square miles (2,780 km2) is land and 0.3 square miles (0.78 km2) (0.02%) is water.[4]
Adjacent counties
- Trego County (north)
- Ellis County (northeast)
- Rush County (east)
- Pawnee County (southeast)
- Hodgeman County (south)
- Finney County (southwest)
- Lane County (west)
- Gove County (northwest)
Demographics
| Historical population | |||
|---|---|---|---|
| Census | Pop. | %± | |
| 1880 | 3,722 | — | |
| 1890 | 4,944 | 32.8% | |
| 1900 | 4,535 | −8.3% | |
| 1910 | 5,883 | 29.7% | |
| 1920 | 7,490 | 27.3% | |
| 1930 | 8,358 | 11.6% | |
| 1940 | 6,864 | −17.9% | |
| 1950 | 6,322 | −7.9% | |
| 1960 | 5,470 | −13.5% | |
| 1970 | 4,791 | −12.4% | |
| 1980 | 4,498 | −6.1% | |
| 1990 | 4,033 | −10.3% | |
| 2000 | 3,454 | −14.4% | |
| 2010 | 3,107 | −10.0% | |
| Est. 2016 | 2,962 | [5] | −4.7% |
| U.S. Decennial Census[6] 1790-1960[7] 1900-1990[8] 1990-2000[9] 2010-2016[1] | |||

As of the census[10] of 2000, there were 3,454 people, 1,516 households, and 977 families residing in the county. The population density was 3 people per square mile (1/km²). There were 1,835 housing units at an average density of 2 per square mile (1/km²). The racial makeup of the county was 98.23% White, 0.06% Black or African American, 0.23% Native American, 0.09% Asian, 0.49% from other races, and 0.90% from two or more races. 1.51% of the population were Hispanic or Latino of any race.
There were 1,516 households out of which 26.10% had children under the age of 18 living with them, 57.10% were married couples living together, 4.70% had a female householder with no husband present, and 35.50% were non-families. 33.50% of all households were made up of individuals and 18.30% had someone living alone who was 65 years of age or older. The average household size was 2.23 and the average family size was 2.83.
In the county, the population was spread out with 22.90% under the age of 18, 4.60% from 18 to 24, 24.00% from 25 to 44, 24.20% from 45 to 64, and 24.20% who were 65 years of age or older. The median age was 44 years. For every 100 females there were 98.50 males. For every 100 females age 18 and over, there were 95.10 males.
The median income for a household in the county was $32,340, and the median income for a family was $39,775. Males had a median income of $27,892 versus $20,037 for females. The per capita income for the county was $17,787. About 6.50% of families and 8.70% of the population were below the poverty line, including 9.50% of those under age 18 and 10.20% of those age 65 or over.
Government
Presidential elections
| Year | Republican | Democratic | Third Parties |
|---|---|---|---|
| 2016 | 84.5% 1,228 | 11.1% 162 | 4.4% 64 |
| 2012 | 83.7% 1,209 | 15.1% 218 | 1.2% 17 |
| 2008 | 79.2% 1,207 | 19.0% 289 | 1.9% 29 |
| 2004 | 77.4% 1,407 | 21.0% 382 | 1.6% 29 |
| 2000 | 75.7% 1,420 | 20.4% 383 | 3.9% 73 |
| 1996 | 68.2% 1,336 | 21.8% 428 | 10.0% 196 |
| 1992 | 43.6% 967 | 25.5% 565 | 30.9% 686 |
| 1988 | 56.6% 1,230 | 40.8% 887 | 2.6% 57 |
| 1984 | 75.3% 1,779 | 22.9% 540 | 1.8% 43 |
| 1980 | 67.5% 1,657 | 25.1% 616 | 7.4% 182 |
| 1976 | 46.5% 1,016 | 50.6% 1,106 | 2.8% 62 |
| 1972 | 68.4% 1,539 | 29.0% 652 | 2.7% 60 |
| 1968 | 58.2% 1,352 | 33.0% 767 | 8.7% 203 |
| 1964 | 39.5% 1,034 | 59.7% 1,562 | 0.7% 19 |
| 1960 | 63.4% 1,683 | 36.2% 960 | 0.5% 12 |
| 1956 | 70.8% 1,876 | 28.6% 758 | 0.6% 16 |
| 1952 | 76.3% 2,288 | 22.1% 664 | 1.6% 48 |
| 1948 | 58.1% 1,689 | 38.9% 1,130 | 3.0% 88 |
| 1944 | 65.5% 1,745 | 32.9% 876 | 1.7% 45 |
| 1940 | 58.7% 1,826 | 39.5% 1,230 | 1.8% 56 |
| 1936 | 39.2% 1,302 | 60.3% 2,002 | 0.5% 18 |
| 1932 | 42.7% 1,409 | 53.6% 1,772 | 3.7% 123 |
| 1928 | 71.5% 2,058 | 27.2% 784 | 1.3% 36 |
| 1924 | 64.6% 1,629 | 21.5% 541 | 13.9% 350 |
| 1920 | 69.3% 1,402 | 24.3% 492 | 6.4% 129 |
| 1916 | 37.6% 927 | 49.2% 1,213 | 13.2% 324 |
| 1912 | 18.1% 232 | 35.8% 458 | 46.1% 590[lower-alpha 1] |
| 1908 | 48.0% 635 | 34.8% 461 | 17.2% 228 |
| 1904 | 58.8% 687 | 16.1% 188 | 25.1% 293 |
| 1900 | 44.9% 511 | 51.2% 583 | 3.9% 44 |
| 1896 | 39.0% 354 | 58.0% 526 | 3.0% 27 |
| 1892 | 44.4% 495 | 55.6% 619 | |
| 1888 | 57.3% 891 | 30.2% 470 | 12.5% 195 |
Ness County is presently overwhelmingly Republican, although it was won by Jimmy Carter for the Democratic Party as recently as 1976. However, apart from Carter and Lyndon Johnson in 1964, no Democrat since 1940 has reached forty percent of the county’s ballots. Since Carter’s win, however, Michael Dukakis in 1988 – during a major drought on the Great Plains – has reached so much as 26 percent of the county’s vote. In 2016, Hillary Clinton received less than half even this modest figure.
Laws
Following amendment to the Kansas Constitution in 1986, the county remained a prohibition, or "dry", county until 2004, when voters approved the sale of alcoholic liquor by the individual drink with a 30 percent food sales requirement.[12]
Education
Unified school districts
Communities
Cities
Unincorporated communities
Ghost town
Townships
Ness County is divided into ten townships. None of the cities within the county are considered governmentally independent, and all figures for the townships include those of the cities. In the following table, the population center is the largest city (or cities) included in that township's population total, if it is of a significant size.
See also
|
|
References
- 1 2 "State & County QuickFacts". United States Census Bureau. Archived from the original on July 15, 2011. Retrieved July 27, 2014.
- ↑ "Find a County". National Association of Counties. Retrieved 2011-06-07.
- ↑ Kansas Place-Names,John Rydjord, University of Oklahoma Press, 1972, ISBN 0-8061-0994-7
- ↑ "US Gazetteer files: 2010, 2000, and 1990". United States Census Bureau. 2011-02-12. Retrieved 2011-04-23.
- ↑ "Population and Housing Unit Estimates". Retrieved June 9, 2017.
- ↑ "U.S. Decennial Census". United States Census Bureau. Retrieved July 27, 2014.
- ↑ "Historical Census Browser". University of Virginia Library. Retrieved July 27, 2014.
- ↑ "Population of Counties by Decennial Census: 1900 to 1990". United States Census Bureau. Retrieved July 27, 2014.
- ↑ "Census 2000 PHC-T-4. Ranking Tables for Counties: 1990 and 2000" (PDF). United States Census Bureau. Retrieved July 27, 2014.
- ↑ "American FactFinder". United States Census Bureau. Retrieved 2008-01-31.
- ↑ http://uselectionatlas.org/RESULTS
- ↑ "Map of Wet and Dry Counties". Alcoholic Beverage Control, Kansas Department of Revenue. November 2006. Retrieved 2007-12-26.
- ↑ Not a lot left of Nonchalanta but memories; March 13, 2016.
- Notes
- ↑ This total comprises 464 votes (36.35 percent) for Progressive Theodore Roosevelt (who carried the county) and 126 votes (9.84 percent) for Socialist Eugene V. Debs.
Further reading
- Standard Atlas of Ness County, Kansas; Geo. A. Ogle & Co; 64 pages; 1906.
External links
| Wikimedia Commons has media related to Ness County, Kansas. |
- County
- Maps
- Ness County Maps: Current, Historic, KDOT
- Kansas Highway Maps: Current, Historic, KDOT
- Kansas Railroad Maps: Current, 1996, 1915, KDOT and Kansas Historical Society
Places adjacent to Ness County, Kansas | ||||||||||
|---|---|---|---|---|---|---|---|---|---|---|
| ||||||||||
Municipalities and communities of Ness County, Kansas, United States | ||
|---|---|---|
| Cities | | |
| Unincorporated communities | ||
