Wichita County, Kansas
| Wichita County, Kansas | |
|---|---|
| County | |
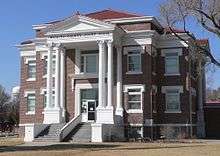 Wichita County courthouse in Leoti | |
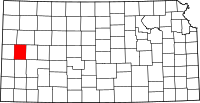 Location in the U.S. state of Kansas | |
 Kansas's location in the U.S. | |
| Founded | December 24, 1886 |
| Named for | Wichita people |
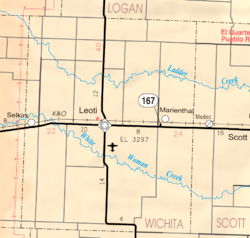
| Seat | Leoti |
| Largest city | Leoti |
| Area | |
| • Total | 719 sq mi (1,862 km2) |
| • Land | 719 sq mi (1,862 km2) |
| • Water | 0.02 sq mi (0 km2), 0.0% |
| Population (est.) | |
| • (2016) | 2,112 |
| • Density | 3.1/sq mi (1.2/km2) |
| Congressional district | 1st |
| Time zone | Central: UTC−6/−5 |
| Website | WichitaCounty.org |
Wichita County (standard abbreviation: WH) is a county located in the U.S. state of Kansas. As of the 2010 census, the county population was 2,234.[1] Its county seat is Leoti.[2]
History
Early history
For many millennia, the Great Plains of North America was inhabited by nomadic Native Americans. From the 16th century to 18th century, the Kingdom of France claimed ownership of large parts of North America. In 1762, after the French and Indian War, France secretly ceded New France to Spain, per the Treaty of Fontainebleau.
19th century
In 1802, Spain returned most of the land to France, but keeping title to about 7,500 square miles. In 1803, most of the land for modern day Kansas was acquired by the United States from France as part of the 828,000 square mile Louisiana Purchase for 2.83 cents per acre.
In 1854, the Kansas Territory was organized, then in 1861 Kansas became the 34th U.S. state. In 1886, Wichita County was established.
Geography
According to the U.S. Census Bureau, the county has a total area of 719 square miles (1,860 km2), virtually all of which is land.[3]
Major highways
Adjacent counties
- Logan County (north)
- Scott County (east)
- Kearny County (south)
- Hamilton County (southwest/Mountain Time border)
- Greeley County (west/Mountain Time border)
- Wallace County (northwest/Mountain Time border)
Demographics
| Historical population | |||
|---|---|---|---|
| Census | Pop. | %± | |
| 1880 | 14 | — | |
| 1890 | 1,827 | 12,950.0% | |
| 1900 | 1,197 | −34.5% | |
| 1910 | 2,006 | 67.6% | |
| 1920 | 1,856 | −7.5% | |
| 1930 | 2,579 | 39.0% | |
| 1940 | 2,185 | −15.3% | |
| 1950 | 2,640 | 20.8% | |
| 1960 | 2,765 | 4.7% | |
| 1970 | 3,274 | 18.4% | |
| 1980 | 3,041 | −7.1% | |
| 1990 | 2,758 | −9.3% | |
| 2000 | 2,531 | −8.2% | |
| 2010 | 2,234 | −11.7% | |
| Est. 2016 | 2,112 | [4] | −5.5% |
| U.S. Decennial Census[5] 1790-1960[6] 1900-1990[7] 1990-2000[8] 2010-2016[1] | |||
As of the census[9] of 2000, there were 2,531 people, 967 households, and 723 families residing in the county. The population density was 4 people per square mile (1/km²). There were 1,119 housing units at an average density of 2 per square mile (1/km²). The racial makeup of the county was 86.25% White, 0.08% Black or African American, 0.71% Native American, 0.08% Asian, 10.51% from other races, and 2.37% from two or more races. 18.41% of the population were Hispanic or Latino of any race.
There were 967 households out of which 35.10% had children under the age of 18 living with them, 65.30% were married couples living together, 5.80% had a female householder with no husband present, and 25.20% were non-families. 23.70% of all households were made up of individuals and 10.00% had someone living alone who was 65 years of age or older. The average household size was 2.59 and the average family size was 3.07.
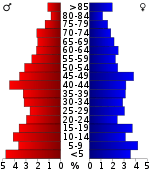
In the county, the population was spread out with 28.70% under the age of 18, 7.30% from 18 to 24, 25.70% from 25 to 44, 22.30% from 45 to 64, and 16.00% who were 65 years of age or older. The median age was 37 years. For every 100 females there were 104.40 males. For every 100 females age 18 and over, there were 102.60 males.
The median income for a household in the county was $33,462, and the median income for a family was $41,034. Males had a median income of $27,523 versus $18,807 for females. The per capita income for the county was $16,720. About 11.20% of families and 14.80% of the population were below the poverty line, including 23.20% of those under age 18 and 4.70% of those age 65 or over.
Government
Presidential elections
| Year | Republican | Democratic | Third Parties |
|---|---|---|---|
| 2016 | 80.4% 769 | 14.6% 140 | 4.9% 47 |
| 2012 | 83.2% 821 | 15.9% 157 | 0.9% 9 |
| 2008 | 82.4% 840 | 16.0% 163 | 1.6% 16 |
| 2004 | 81.8% 869 | 17.2% 183 | 0.9% 10 |
| 2000 | 78.8% 859 | 19.0% 207 | 2.2% 24 |
| 1996 | 71.1% 796 | 21.4% 239 | 7.5% 84 |
| 1992 | 55.4% 681 | 19.6% 241 | 25.0% 308 |
| 1988 | 62.8% 721 | 34.8% 399 | 2.4% 28 |
| 1984 | 78.9% 916 | 20.0% 232 | 1.1% 13 |
| 1980 | 70.0% 880 | 24.1% 303 | 6.0% 75 |
| 1976 | 47.9% 593 | 49.6% 614 | 2.5% 31 |
| 1972 | 69.9% 794 | 25.4% 288 | 4.8% 54 |
| 1968 | 60.4% 757 | 29.0% 364 | 10.6% 133 |
| 1964 | 44.2% 529 | 55.3% 662 | 0.5% 6 |
| 1960 | 55.6% 702 | 43.9% 554 | 0.5% 6 |
| 1956 | 70.4% 747 | 29.4% 312 | 0.2% 2 |
| 1952 | 75.9% 910 | 23.0% 276 | 1.1% 13 |
| 1948 | 56.3% 606 | 41.1% 443 | 2.6% 28 |
| 1944 | 64.3% 604 | 35.0% 329 | 0.6% 6 |
| 1940 | 59.1% 644 | 39.7% 433 | 1.2% 13 |
| 1936 | 41.1% 448 | 58.4% 637 | 0.6% 6 |
| 1932 | 32.9% 375 | 64.3% 732 | 2.8% 32 |
| 1928 | 54.9% 464 | 43.8% 370 | 1.3% 11 |
| 1924 | 62.7% 482 | 19.1% 147 | 18.2% 140 |
| 1920 | 73.9% 422 | 22.2% 127 | 3.9% 22 |
| 1916 | 44.0% 318 | 46.1% 333 | 9.8% 71 |
| 1912 | 22.1% 82 | 36.4% 135 | 41.5% 154[lower-alpha 1] |
| 1908 | 54.3% 233 | 40.3% 173 | 5.4% 23 |
| 1904 | 67.3% 245 | 25.0% 91 | 7.7% 28 |
| 1900 | 60.4% 201 | 38.4% 128 | 1.2% 4 |
| 1896 | 52.3% 214 | 46.9% 192 | 0.7% 3 |
| 1892 | 53.3% 245 | 46.7% 215 | |
| 1888 | 59.4% 438 | 28.1% 207 | 12.6% 93 |
Wichita County is overwhelmingly Republican. It was last carried for the Democratic Party by Jimmy Carter in 1976, but since then the only Democrat to win over a quarter of the county’s vote has been Michael Dukakis during the 1988 election when the Democratic vote was boosted by reaction against a major Great Plains drought. In the past six elections no Democrat has topped twenty percent of Wichita County’s vote – a situation now almost general in the High Plains.
Laws
Although the Kansas Constitution was amended in 1986 to allow the sale of alcoholic liquor by the individual drink with the approval of voters, Wichita County has remained a prohibition, or "dry", county.[11]
Education
- Leoti USD 467
Communities
City
Unincorporated communities
Ghost towns
Townships
Wichita County has a single township. None of the cities within the county are considered governmentally independent, and all figures for the townships include those of the cities. In the following table, the population center is the largest city (or cities) included in that township's population total, if it is of a significant size.
| Township | FIPS | Population center |
Population | Population density /km² (/sq mi) |
Land area km² (sq mi) | Water area km² (sq mi) | Water % | Geographic coordinates |
|---|---|---|---|---|---|---|---|---|
| Leoti | 39575 | Leoti | 2,531 | 1 (4) | 1,861 (719) | 0 (0) | 0% | 38°29′54″N 101°21′50″W / 38.49833°N 101.36389°W |
See also
|
|
References
- 1 2 "State & County QuickFacts". United States Census Bureau. Retrieved July 29, 2014.
- ↑ "Find a County". National Association of Counties. Retrieved 2011-06-07.
- ↑ "US Gazetteer files: 2010, 2000, and 1990". United States Census Bureau. 2011-02-12. Retrieved 2011-04-23.
- ↑ "Population and Housing Unit Estimates". Retrieved June 9, 2017.
- ↑ "U.S. Decennial Census". United States Census Bureau. Retrieved July 29, 2014.
- ↑ "Historical Census Browser". University of Virginia Library. Retrieved July 29, 2014.
- ↑ "Population of Counties by Decennial Census: 1900 to 1990". United States Census Bureau. Retrieved July 29, 2014.
- ↑ "Census 2000 PHC-T-4. Ranking Tables for Counties: 1990 and 2000" (PDF). United States Census Bureau. Retrieved July 29, 2014.
- ↑ "American FactFinder". United States Census Bureau. Retrieved 2008-01-31.
- ↑ http://uselectionatlas.org/RESULTS
- ↑ "Map of Wet and Dry Counties". Alcoholic Beverage Control, Kansas Department of Revenue. November 2004. Archived from the original on 2007-10-08. Retrieved 2007-01-21.
- Notes
- ↑ This comprises 113 votes (30.5%) for Progressive Theodore Roosevelt and 41 votes (11.1%) for Socialist Eugene V. Debs.
Further reading
- Standard Atlas of Wichita County, Kansas; Geo. A. Ogle & Co; 60 pages; 1920.
External links
| Wikimedia Commons has media related to Wichita County, Kansas. |
| Wikisource has the text of an 1879 American Cyclopædia article about Wichita County, Kansas. |
- County
- Maps
- Wichita County Maps: Current, Historic, KDOT
- Kansas Highway Maps: Current, Historic, KDOT
- Kansas Railroad Maps: Current, 1996, 1915, KDOT and Kansas Historical Society
Places adjacent to Wichita County, Kansas | ||||||||||
|---|---|---|---|---|---|---|---|---|---|---|
| ||||||||||
Municipalities and communities of Wichita County, Kansas, United States | ||
|---|---|---|
| City | | |
| CDP | ||
| Unincorporated communities | ||
| Ghost towns | ||
