Morton County, Kansas
| Morton County, Kansas | |
|---|---|
| County | |
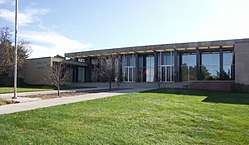 Morton County Courthouse in Elkhart | |
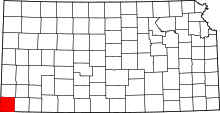 Location in the U.S. state of Kansas | |
 Kansas's location in the U.S. | |
| Founded | February 20, 1886 |
| Named for | Oliver Morton |
| Seat | Elkhart |
| Largest city | Elkhart |
| Area | |
| • Total | 730 sq mi (1,891 km2) |
| • Land | 730 sq mi (1,891 km2) |
| • Water | 0.2 sq mi (1 km2), 0.03% |
| Population (est.) | |
| • (2016) | 2,848 |
| • Density | 4.4/sq mi (1.7/km2) |
| Congressional district | 1st |
| Time zone | Central: UTC−6/−5 |
| Website | mtcoks.com |
Morton County (standard abbreviation: MT) is a county in the southwestern corner of the U.S. state of Kansas. As of the 2010 census, the county population was 3,233.[1] The largest city and county seat is Elkhart.[2]
History
Early history
For many millennia, the Great Plains of North America was inhabited by nomadic Native Americans. From the 16th century to 18th century, the Kingdom of France claimed ownership of large parts of North America. In 1762, after the French and Indian War, France secretly ceded New France to Spain, per the Treaty of Fontainebleau.
19th century
In 1802, Spain returned most of the land to France, but keeping title to about 7,500 square miles. In 1803, most of the land for modern day Kansas was acquired by the United States from France as part of the 828,000 square mile Louisiana Purchase for 2.83 cents per acre.
In 1848, after the Mexican–American War, the Treaty of Guadalupe Hidalgo with Spain brought into the United States all or part of land for ten future states, including southwest Kansas.
From 1821 to late 1860s, the Santa Fe Trail was active across Morton County.
In 1854, the Kansas Territory was organized, then in 1861 Kansas became the 34th U.S. state. In 1886, Morton County was established, and named for Oliver Morton, who was a United States Senator from Indiana from 1867 to 1877.[3] In 1886, the community of Richfield was established as the county seat.[4]
20th century

In the 1930s, the prosperity of the area was severely affected by its location within the Dust Bowl. This catastrophe intensified the economic impact of the Great Depression in the region.
In 1961, the county seat was moved from Richfield to Elkhart.[4]
Geography
According to the U.S. Census Bureau, the county has a total area of 730 square miles (1,900 km2), of which 730 square miles (1,900 km2) is land and 0.2 square miles (0.52 km2) (0.03%) is water.[5]
Major highways
Adjacent counties
- Stanton County (north)
- Stevens County (east)
- Texas County, Oklahoma (south)
- Cimarron County, Oklahoma (southwest)
- Baca County, Colorado (west/Mountain Time border)
National protected area
- Cimarron National Grassland (part)
Demographics
| Historical population | |||
|---|---|---|---|
| Census | Pop. | %± | |
| 1890 | 724 | — | |
| 1900 | 304 | −58.0% | |
| 1910 | 1,333 | 338.5% | |
| 1920 | 3,177 | 138.3% | |
| 1930 | 4,092 | 28.8% | |
| 1940 | 2,186 | −46.6% | |
| 1950 | 2,610 | 19.4% | |
| 1960 | 3,354 | 28.5% | |
| 1970 | 3,576 | 6.6% | |
| 1980 | 3,454 | −3.4% | |
| 1990 | 3,480 | 0.8% | |
| 2000 | 3,496 | 0.5% | |
| 2010 | 3,233 | −7.5% | |
| Est. 2016 | 2,848 | [6] | −11.9% |
| U.S. Decennial Census[7] 1790-1960[8] 1900-1990[9] 1990-2000[10] 2010-2016[1] | |||
As of the census[11] of 2000, there were 3,496 people, 1,306 households, and 961 families residing in the county. The population density was 5 people per square mile (2/km²). There were 1,519 housing units at an average density of 2 per square mile (1/km²). The racial makeup of the county was 88.39% White, 0.20% Black or African American, 1.14% Native American, 1.06% Asian, 7.52% from other races, and 1.69% from two or more races. 14.10% of the population were Hispanic or Latino of any race.
There were 1,306 households out of which 36.60% had children under the age of 18 living with them, 64.20% were married couples living together, 6.80% had a female householder with no husband present, and 26.40% were non-families. 24.30% of all households were made up of individuals and 9.20% had someone living alone who was 65 years of age or older. The average household size was 2.63 and the average family size was 3.15.
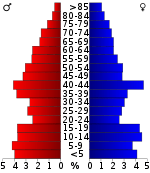
In the county, the population was spread out with 29.30% under the age of 18, 8.00% from 18 to 24, 27.20% from 25 to 44, 21.50% from 45 to 64, and 13.90% who were 65 years of age or older. The median age was 36 years. For every 100 females there were 94.40 males. For every 100 females age 18 and over, there were 93.70 males.
The median income for a household in the county was $37,232, and the median income for a family was $43,494. Males had a median income of $31,875 versus $19,474 for females. The per capita income for the county was $17,076. About 8.50% of families and 10.50% of the population were below the poverty line, including 14.00% of those under age 18 and 5.20% of those age 65 or over.
Government
Presidential elections
| Year | Republican | Democratic | Third Parties |
|---|---|---|---|
| 2016 | 83.5% 995 | 12.3% 147 | 4.2% 50 |
| 2012 | 83.9% 1,072 | 14.8% 189 | 1.3% 17 |
| 2008 | 82.2% 1,153 | 16.3% 229 | 1.4% 20 |
| 2004 | 81.7% 1,287 | 17.5% 276 | 0.8% 13 |
| 2000 | 77.3% 1,203 | 20.6% 321 | 2.1% 33 |
| 1996 | 67.9% 1,073 | 23.8% 376 | 8.4% 132 |
| 1992 | 54.8% 915 | 23.8% 398 | 21.4% 357 |
| 1988 | 64.4% 1,074 | 34.1% 569 | 1.6% 26 |
| 1984 | 81.8% 1,533 | 17.2% 322 | 1.0% 19 |
| 1980 | 69.6% 1,157 | 24.9% 414 | 5.5% 91 |
| 1976 | 48.9% 738 | 48.7% 735 | 2.4% 36 |
| 1972 | 72.7% 1,165 | 22.7% 363 | 4.7% 75 |
| 1968 | 51.0% 770 | 31.5% 475 | 17.5% 264 |
| 1964 | 39.0% 609 | 60.1% 938 | 0.9% 14 |
| 1960 | 60.7% 918 | 38.7% 586 | 0.6% 9 |
| 1956 | 64.8% 814 | 34.7% 436 | 0.6% 7 |
| 1952 | 69.9% 893 | 28.4% 362 | 1.7% 22 |
| 1948 | 52.6% 624 | 46.0% 545 | 1.4% 17 |
| 1944 | 62.5% 617 | 37.2% 367 | 0.3% 3 |
| 1940 | 55.7% 643 | 43.6% 503 | 0.7% 8 |
| 1936 | 41.8% 636 | 57.6% 876 | 0.6% 9 |
| 1932 | 34.6% 621 | 61.0% 1,093 | 4.4% 79 |
| 1928 | 78.8% 1,010 | 20.2% 259 | 1.0% 13 |
| 1924 | 55.0% 669 | 23.5% 286 | 21.5% 261 |
| 1920 | 73.0% 783 | 24.8% 266 | 2.2% 24 |
| 1916 | 42.4% 405 | 47.9% 457 | 9.7% 93 |
| 1912 | 34.0% 120 | 40.8% 144 | 25.2% 89 |
| 1908 | 50.5% 154 | 45.9% 140 | 3.6% 11 |
| 1904 | 54.1% 53 | 44.9% 44 | 1.0% 1 |
| 1900 | 60.0% 51 | 40.0% 34 | 0.0% 0 |
| 1896 | 58.4% 52 | 40.5% 36 | 1.1% 1 |
| 1892 | 57.6% 106 | 42.4% 78 | |
| 1888 | 58.0% 333 | 35.7% 205 | 6.3% 36 |
Laws
Although the Kansas Constitution was amended in 1986 to allow the sale of alcoholic liquor by the individual drink with the approval of voters, Morton County has remained a prohibition, or "dry", county.[13]
Education
Unified school districts
Communities

Cities
Unincorporated community
Townships
Morton County is divided into six townships. None of the cities within the county are considered governmentally independent, and all figures for the townships include those of the cities. In the following table, the population center is the largest city (or cities) included in that township's population total, if it is of a significant size.
| Township | FIPS | Population center |
Population | Population density /km² (/sq mi) |
Land area km² (sq mi) | Water area km² (sq mi) | Water % | Geographic coordinates |
|---|---|---|---|---|---|---|---|---|
| Cimarron | 13350 | 67 | 0 (1) | 173 (67) | 0 (0) | 0% | 37°4′11″N 101°46′45″W / 37.06972°N 101.77917°W | |
| Jones | 35650 | 17 | 0 (0) | 140 (54) | 0 (0) | 0% | 37°1′4″N 101°56′56″W / 37.01778°N 101.94889°W | |
| Richfield | 59225 | 218 | 0 (1) | 649 (251) | 0 (0) | 0% | 37°14′37″N 101°42′36″W / 37.24361°N 101.71000°W | |
| Rolla | 60925 | Rolla | 650 | 2 (5) | 373 (144) | 0 (0) | 0% | 37°6′46″N 101°37′42″W / 37.11278°N 101.62833°W |
| Taloga | 69975 | Elkhart | 2,437 | 17 (44) | 142 (55) | 0 (0) | 0% | 37°0′22″N 101°53′42″W / 37.00611°N 101.89500°W |
| Westola | 77225 | 107 | 0 (1) | 412 (159) | 0 (0) | 0.01% | 37°14′19″N 101°58′40″W / 37.23861°N 101.97778°W |
See also
|
|
References
- 1 2 "State & County QuickFacts". United States Census Bureau. Archived from the original on July 15, 2011. Retrieved July 27, 2014.
- ↑ "Find a County". National Association of Counties. Retrieved 2011-06-07.
- ↑ "Archived copy". Archived from the original on 2008-11-21. Retrieved 2010-04-17.
- 1 2 Morton County Facts; mtcoks.com
- ↑ "US Gazetteer files: 2010, 2000, and 1990". United States Census Bureau. 2011-02-12. Retrieved 2011-04-23.
- ↑ "Population and Housing Unit Estimates". Retrieved June 9, 2017.
- ↑ "U.S. Decennial Census". United States Census Bureau. Retrieved July 27, 2014.
- ↑ "Historical Census Browser". University of Virginia Library. Retrieved July 27, 2014.
- ↑ "Population of Counties by Decennial Census: 1900 to 1990". United States Census Bureau. Retrieved July 27, 2014.
- ↑ "Census 2000 PHC-T-4. Ranking Tables for Counties: 1990 and 2000" (PDF). United States Census Bureau. Retrieved July 27, 2014.
- ↑ "American FactFinder". United States Census Bureau. Retrieved 2008-01-31.
- ↑ http://uselectionatlas.org/RESULTS
- ↑ "Map of Wet and Dry Counties". Alcoholic Beverage Control, Kansas Department of Revenue. November 2004. Archived from the original on 2007-10-08. Retrieved 2007-01-21.
Further reading
- The Story of the Marking of the Santa Fe Trail by the Daughters of the American Revolution in Kansas and the State of Kansas; Almira Cordry; Crane Co; 164 pages; 1915.
External links
| Wikimedia Commons has media related to Morton County, Kansas. |
- County
- Maps
- Morton County Maps: Current, Historic, KDOT
- Kansas Highway Maps: Current, Historic, KDOT
- Kansas Railroad Maps: Current, 1996, 1915, KDOT and Kansas Historical Society
Places adjacent to Morton County, Kansas | ||||||||||
|---|---|---|---|---|---|---|---|---|---|---|
| ||||||||||
Municipalities and communities of Morton County, Kansas, United States | ||
|---|---|---|
| Cities | | |
| Unincorporated community | ||
