Clark County, Kansas
| Clark County, Kansas | |
|---|---|
| County | |
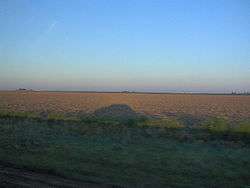
_from_SE_2.JPG) | |
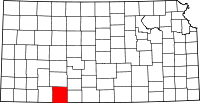 Location in the U.S. state of Kansas | |
 Kansas's location in the U.S. | |
| Coordinates: 37°14′N 99°50′W / 37.233°N 99.833°W | |
| Founded | February 26, 1867 |
| Named for | Charles F. Clarke |
| Seat | Ashland |
| Largest city | Ashland |
| Area | |
| • Total | 977 sq mi (2,530 km2) |
| • Land | 975 sq mi (2,525 km2) |
| • Water | 2.6 sq mi (7 km2), 0.3% |
| Population (est.) | |
| • (2016) | 2,072 |
| • Density | 2.3/sq mi (0.9/km2) |
| Area code(s) | 620 |
| Congressional district | 1st |
| Time zone | Central: UTC−6/−5 |
| Website | ClarkCountyKS.com |
Clark County (county code CA) is a county located in the U.S. state of Kansas. As of the 2010 census, the county population was 2,215.[1] Its county seat and most populous city is Ashland.[2]
Geography
According to the U.S. Census Bureau, the county has a total area of 977 square miles (2,530 km2), of which 975 square miles (2,530 km2) is land and 2.6 square miles (6.7 km2) (%) is water.[3]
Adjacent counties
- Ford County (north)
- Kiowa County (northeast)
- Comanche County (east)
- Harper County, Oklahoma (southeast)
- Beaver County, Oklahoma (southwest)
- Meade County (west)
Major highways
Demographics
| Historical population | |||
|---|---|---|---|
| Census | Pop. | %± | |
| 1880 | 163 | — | |
| 1890 | 2,357 | 1,346.0% | |
| 1900 | 1,701 | −27.8% | |
| 1910 | 4,093 | 140.6% | |
| 1920 | 4,989 | 21.9% | |
| 1930 | 4,796 | −3.9% | |
| 1940 | 4,081 | −14.9% | |
| 1950 | 3,946 | −3.3% | |
| 1960 | 3,396 | −13.9% | |
| 1970 | 2,896 | −14.7% | |
| 1980 | 2,599 | −10.3% | |
| 1990 | 2,418 | −7.0% | |
| 2000 | 2,390 | −1.2% | |
| 2010 | 2,215 | −7.3% | |
| Est. 2016 | 2,072 | [6] | −6.5% |
| U.S. Decennial Census[7] 1790-1960[8] 1900-1990[9] 1990-2000[10] 2010-2016[1] | |||

As of the 2000 census,[11] there were 2,390 people, 979 households, and 676 families residing in the county. The population density was 2 people per square mile (1/km²). There were 1,111 housing units at an average density of 1 per square mile (0/km²). The racial makeup of the county was 95.77% White, 0.25% Black or African American, 1.13% Native American, 0.08% Asian, 1.88% from other races, and 0.88% from two or more races. Hispanic or Latino of any race were 4.02% of the population.
There were 979 households out of which 30.20% had children under the age of 18 living with them, 60.30% were married couples living together, 6.20% had a female householder with no husband present, and 30.90% were non-families. 29.60% of all households were made up of individuals and 17.00% had someone living alone who was 65 years of age or older. The average household size was 2.39 and the average family size was 2.95.
In the county, the population was spread out with 26.60% under the age of 18, 4.90% from 18 to 24, 23.10% from 25 to 44, 23.60% from 45 to 64, and 21.80% who were 65 years of age or older. The median age was 42 years. For every 100 females there were 95.60 males. For every 100 females age 18 and over, there were 88.50 males.
The median income for a household in the county was $33,857, and the median income for a family was $40,521. Males had a median income of $27,321 versus $20,833 for females. The per capita income for the county was $17,795. About 11.30% of families and 12.70% of the population were below the poverty line, including 18.00% of those under age 18 and 10.20% of those age 65 or over.
Government
Presidential elections
| Year | Republican | Democratic | Third Parties |
|---|---|---|---|
| 2016 | 82.1% 825 | 11.9% 120 | 6.0% 60 |
| 2012 | 79.2% 805 | 17.1% 174 | 3.7% 38 |
| 2008 | 77.4% 897 | 21.1% 245 | 1.5% 17 |
| 2004 | 78.5% 1,014 | 19.9% 257 | 1.6% 20 |
| 2000 | 73.4% 926 | 23.2% 292 | 3.4% 43 |
| 1996 | 65.0% 855 | 25.4% 334 | 9.6% 126 |
| 1992 | 51.5% 676 | 22.3% 293 | 26.2% 344 |
| 1988 | 66.6% 876 | 31.1% 409 | 2.3% 30 |
| 1984 | 75.4% 1,075 | 22.7% 324 | 1.9% 27 |
| 1980 | 63.6% 901 | 30.4% 430 | 6.1% 86 |
| 1976 | 51.8% 761 | 46.3% 680 | 1.9% 28 |
| 1972 | 76.0% 1,142 | 20.7% 311 | 3.3% 49 |
| 1968 | 58.3% 920 | 28.3% 446 | 13.5% 213 |
| 1964 | 46.7% 777 | 52.9% 881 | 0.4% 7 |
| 1960 | 70.3% 1,286 | 29.4% 538 | 0.3% 6 |
| 1956 | 69.8% 1,243 | 29.7% 529 | 0.5% 8 |
| 1952 | 73.3% 1,410 | 24.9% 479 | 1.8% 35 |
| 1948 | 55.3% 999 | 43.0% 777 | 1.7% 31 |
| 1944 | 55.7% 950 | 43.4% 741 | 0.9% 15 |
| 1940 | 49.5% 1,072 | 49.8% 1,079 | 0.7% 16 |
| 1936 | 38.1% 899 | 61.8% 1,457 | 0.1% 2 |
| 1932 | 44.5% 938 | 54.7% 1,152 | 0.8% 16 |
| 1928 | 76.4% 1,383 | 23.2% 419 | 0.4% 8 |
| 1924 | 59.2% 969 | 25.0% 410 | 15.8% 259 |
| 1920 | 58.0% 923 | 38.3% 610 | 3.7% 59 |
| 1916 | 34.4% 653 | 58.0% 1,102 | 7.6% 144 |
| 1912 | 14.5% 162 | 43.5% 485 | 41.9% 467 |
| 1908 | 49.9% 386 | 45.2% 350 | 4.9% 38 |
| 1904 | 60.7% 246 | 32.4% 131 | 6.9% 28 |
| 1900 | 49.1% 201 | 48.7% 199 | 2.2% 9 |
| 1896 | 48.7% 182 | 51.1% 191 | 0.3% 1 |
| 1892 | 42.4% 226 | 57.6% 307 | |
| 1888 | 51.3% 473 | 37.9% 349 | 10.9% 100 |
Laws
Although the Kansas Constitution was amended in 1986 to allow the sale of alcoholic liquor by the individual drink with the approval of voters, Clark County has remained a prohibition, or "dry", county.[13]
Education
Unified school districts
Communities

Cities
Unincorporated communities
- Acres
- Letitia
- Lexington
- Sitka
Ghost towns
- Appleton
- Cash City[14]
- Vanham
Townships
Clark County is divided into six townships. None of the cities within the county are considered governmentally independent, and all figures for the townships include those of the cities. In the following table, the population center is the largest city (or cities) included in that township's population total, if it is of a significant size.
| Township | FIPS | Population center |
Population | Population density /km² (/sq mi) |
Land area km² (sq mi) | Water area km² (sq mi) | Water % | Geographic coordinates |
|---|---|---|---|---|---|---|---|---|
| Appleton | 02100 | Minneola | 921 | 1 (4) | 630 (243) | 2 (1) | 0.29% | 37°23′28″N 99°55′57″W / 37.39111°N 99.93250°W |
| Center | 11600 | Ashland | 1,097 | 2 (5) | 528 (204) | 2 (1) | 0.31% | 37°10′15″N 99°47′52″W / 37.17083°N 99.79778°W |
| Englewood | 21375 | Englewood | 171 | 0 (1) | 536 (207) | 0 (0) | 0.07% | 37°6′5″N 99°59′7″W / 37.10139°N 99.98528°W |
| Lexington | 39775 | 83 | 0 (1) | 232 (90) | 0 (0) | 0.21% | 37°19′20″N 99°38′41″W / 37.32222°N 99.64472°W | |
| Liberty | 39900 | 32 | 0 (1) | 155 (60) | 0 (0) | 0.05% | 37°25′6″N 99°39′18″W / 37.41833°N 99.65500°W | |
| Sitka | 65725 | 86 | 0 (1) | 444 (171) | 2 (1) | 0.48% | 37°8′13″N 99°38′28″W / 37.13694°N 99.64111°W | |
| Sources: "Census 2000 U.S. Gazetteer Files". U.S. Census Bureau, Geography Division. Archived from the original on 2002-08-02. | ||||||||
See also
|
|
References
- 1 2 "State & County QuickFacts". United States Census Bureau. Retrieved July 22, 2014.
- ↑ "Find a County". National Association of Counties. Archived from the original on 2011-05-31. Retrieved 2011-06-07.
- ↑ "US Gazetteer files: 2010, 2000, and 1990". United States Census Bureau. 2011-02-12. Retrieved 2011-04-23.
- ↑ National Atlas Archived December 5, 2008, at the Wayback Machine.
- ↑ U.S. Census Bureau TIGER shape files
- ↑ "Population and Housing Unit Estimates". Retrieved June 9, 2017.
- ↑ "U.S. Decennial Census". United States Census Bureau. Archived from the original on May 12, 2015. Retrieved July 22, 2014.
- ↑ "Historical Census Browser". University of Virginia Library. Retrieved July 22, 2014.
- ↑ "Population of Counties by Decennial Census: 1900 to 1990". United States Census Bureau. Retrieved July 22, 2014.
- ↑ "Census 2000 PHC-T-4. Ranking Tables for Counties: 1990 and 2000" (PDF). United States Census Bureau. Retrieved July 22, 2014.
- ↑ "American FactFinder". United States Census Bureau. Archived from the original on 2013-09-11. Retrieved 2008-01-31.
- ↑ http://uselectionatlas.org/RESULTS
- ↑ "Map of Wet and Dry Counties". Alcoholic Beverage Control, Kansas Department of Revenue. November 2006. Archived from the original on 2007-10-08. Retrieved 2007-12-26.
- ↑ Blackmar, Frank Wilson (1912). Kansas: A Cyclopedia of State History, Embracing Events, Institutions, Industries, Counties, Cities, Towns, Prominent Persons, Etc. Standard Publishing Company. p. 298.
Further reading
- Plat Book of Clark County, Kansas; Dick Mackey; 37 pages; 1909.
External links
| Wikimedia Commons has media related to Clark County, Kansas. |
- County
- Maps
- Clark County Maps: Current, Historic, KDOT
- Kansas Highway Maps: Current, Historic, KDOT
- Kansas Railroad Maps: Current, 1996, 1915, KDOT and Kansas Historical Society
Places adjacent to Clark County, Kansas | |
|---|---|
Municipalities and communities of Clark County, Kansas, United States | ||
|---|---|---|
| Cities | | |
| Unincorporated communities | ||
| Townships | ||
