Marshall County, Kansas
| Marshall County, Kansas | |
|---|---|
| County | |
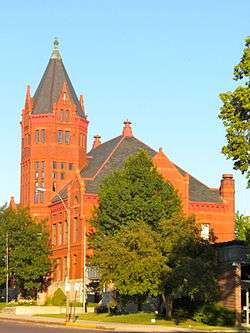 Marshall County Courthouse in Marysville | |
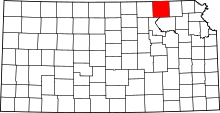 Location in the U.S. state of Kansas | |
 Kansas's location in the U.S. | |
| Founded | August 25, 1855 |
| Named for | Frank J. Marshall |
| Seat | Marysville |
| Largest city | Marysville |
| Area | |
| • Total | 905 sq mi (2,344 km2) |
| • Land | 900 sq mi (2,331 km2) |
| • Water | 4.9 sq mi (13 km2), 0.20% |
| Population (est.) | |
| • (2016) | 9,836 |
| • Density | 11/sq mi (4/km2) |
| Congressional districts | 1st, 2nd |
| Time zone | Central: UTC−6/−5 |
| Website | ks-marshall.manatron.com |
Marshall County (standard abbreviation: MS) is a county located in the U.S. state of Kansas. As of the 2010 census, the county population was 10,117.[1] The largest city and county seat is Marysville.[2]
History
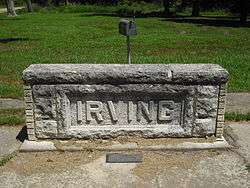
The Oregon Trail crosses Marshall County. The Infamous Donner Reed Party rested along the banks of the Big Blue river and lost one of its members, Sarah Keyes, who is still buried at Alcove Springs (located outside of Marysville). Many documented pioneer bodies are buried surrounding Alcove Spring.
In 1849 Francis James Marshall, from Weston, Missouri, came to Marshall County and established a ferry service on the Big Blue River at "Independence Crossing." A few years later Francis Marshall decided to stay on in Marshall County and make it his home. He moved his Ferry business to an upper crossing now known as Marysville (the city is named after Marshall's own wife Mary).[3]
On May 30, 1879, the "Irving, Kansas Tornado" passed through Marshall county. This tornado measured F4 on the Fujita scale and had a damage path 800 yards (730 m) wide and 100 miles (160 km) long. Eighteen people were killed and sixty were injured.[4]
The Marshall County Historical Society resides in the county's historic courthouse. Which is now a Museum and Research Library. The building is grand and beautiful.
Geography
According to the U.S. Census Bureau, the county has a total area of 905 square miles (2,340 km2), of which 900 square miles (2,300 km2) is land and 4.9 square miles (13 km2) (0.5%) is water.[5]
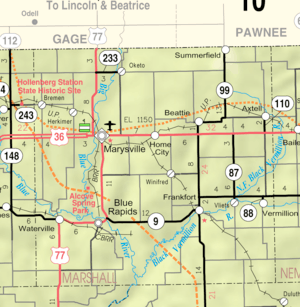
Adjacent counties
- Pawnee County, Nebraska (northeast)
- Nemaha County (east)
- Pottawatomie County (south)
- Riley County (southwest)
- Washington County (west)
- Gage County, Nebraska (northwest)
Demographics
| Historical population | |||
|---|---|---|---|
| Census | Pop. | %± | |
| 1860 | 74 | — | |
| 1870 | 768 | 937.8% | |
| 1880 | 12,453 | 1,521.5% | |
| 1890 | 20,539 | 64.9% | |
| 1900 | 24,355 | 18.6% | |
| 1910 | 23,880 | −2.0% | |
| 1920 | 22,730 | −4.8% | |
| 1930 | 23,056 | 1.4% | |
| 1940 | 20,986 | −9.0% | |
| 1950 | 17,926 | −14.6% | |
| 1960 | 15,598 | −13.0% | |
| 1970 | 13,139 | −15.8% | |
| 1980 | 12,787 | −2.7% | |
| 1990 | 11,705 | −8.5% | |
| 2000 | 10,965 | −6.3% | |
| 2010 | 10,117 | −7.7% | |
| Est. 2016 | 9,836 | [6] | −2.8% |
| U.S. Decennial Census[7] 1790-1960[8] 1900-1990[9] 1990-2000[10] 2010-2016[1] | |||
As of the census[11] of 2000, there were 10,965 people, 4,458 households, and 3,026 families residing in the county. The population density was 12 people per square mile (5/km²). There were 4,999 housing units at an average density of 6 per square mile (2/km²). The racial makeup of the county was 98.14% White, 0.23% Black or African American, 0.36% Native American, 0.19% Asian, 0.02% Pacific Islander, 0.26% from other races, and 0.80% from two or more races. 0.76% of the population were Hispanic or Latino of any race.
There were 4,458 households out of which 30.20% had children under the age of 18 living with them, 59.70% were married couples living together, 5.40% had a female householder with no husband present, and 32.10% were non-families. 29.50% of all households were made up of individuals and 17.00% had someone living alone who was 65 years of age or older. The average household size was 2.40 and the average family size was 2.98.
In the county, the population was spread out with 25.00% under the age of 18, 6.60% from 18 to 24, 23.60% from 25 to 44, 22.80% from 45 to 64, and 22.00% who were 65 years of age or older. The median age was 42 years. For every 100 females there were 96.80 males. For every 100 females age 18 and over, there were 94.00 males.
The median income for a household in the county was $32,089, and the median income for a family was $39,705. Males had a median income of $28,361 versus $19,006 for females. The per capita income for the county was $17,090. About 6.40% of families and 9.20% of the population were below the poverty line, including 9.60% of those under age 18 and 9.10% of those age 65 or over.
Government
Presidential elections
| Year | Republican | Democratic | Third Parties |
|---|---|---|---|
| 2016 | 70.8% 3,307 | 22.9% 1,072 | 6.3% 294 |
| 2012 | 66.9% 3,195 | 30.8% 1,469 | 2.3% 109 |
| 2008 | 62.7% 3,157 | 35.4% 1,784 | 1.9% 95 |
| 2004 | 63.8% 3,261 | 35.0% 1,789 | 1.1% 58 |
| 2000 | 59.9% 3,066 | 35.8% 1,831 | 4.3% 218 |
| 1996 | 51.1% 2,811 | 35.1% 1,932 | 13.8% 757 |
| 1992 | 34.7% 2,030 | 34.5% 2,022 | 30.8% 1,806 |
| 1988 | 54.2% 3,140 | 44.2% 2,560 | 1.6% 90 |
| 1984 | 68.5% 4,098 | 30.3% 1,813 | 1.2% 72 |
| 1980 | 67.7% 4,127 | 25.5% 1,555 | 6.8% 415 |
| 1976 | 52.2% 6,187 | 45.2% 5,366 | 2.6% 307 |
| 1972 | 67.7% 4,127 | 29.9% 1,823 | 2.4% 148 |
| 1968 | 58.9% 3,835 | 29.9% 1,949 | 11.3% 733 |
| 1964 | 50.3% 3,432 | 48.9% 3,334 | 0.8% 56 |
| 1960 | 62.5% 4,932 | 37.1% 2,931 | 0.4% 28 |
| 1956 | 69.3% 5,664 | 30.4% 2,487 | 0.3% 28 |
| 1952 | 75.4% 6,851 | 24.4% 2,215 | 0.3% 26 |
| 1948 | 61.5% 5,122 | 37.8% 3,148 | 0.7% 59 |
| 1944 | 69.6% 6,184 | 30.2% 2,681 | 0.2% 21 |
| 1940 | 66.7% 7,286 | 32.8% 3,588 | 0.5% 57 |
| 1936 | 53.0% 5,929 | 46.8% 5,238 | 0.2% 24 |
| 1932 | 42.3% 4,455 | 56.6% 5,970 | 1.1% 119 |
| 1928 | 67.1% 6,918 | 32.3% 3,329 | 0.7% 69 |
| 1924 | 62.4% 5,809 | 25.4% 2,369 | 12.2% 1,139 |
| 1920 | 71.5% 5,706 | 25.4% 2,026 | 3.2% 252 |
| 1916 | 50.1% 4,581 | 46.7% 4,275 | 3.2% 291 |
| 1912 | 27.0% 1,492 | 41.2% 2,278 | 31.8% 1,759 |
| 1908 | 55.9% 3,296 | 42.7% 2,514 | 1.4% 85 |
| 1904 | 66.1% 3,530 | 29.3% 1,564 | 4.6% 243 |
| 1900 | 55.6% 3,413 | 43.5% 2,669 | 0.9% 53 |
| 1896 | 51.8% 3,052 | 47.1% 2,776 | 1.2% 70 |
| 1892 | 45.3% 2,531 | 54.7% 3,054 | |
| 1888 | 48.3% 2,547 | 34.4% 1,815 | 17.2% 908 |
Laws
Marshall County was a prohibition, or "dry", county until the Kansas Constitution was amended in 1986 and voters approved the sale of alcoholic liquor by the individual drink with a 30 percent food sales requirement.[13]
Education
Unified school districts
- Historical
- Axtell USD 488 (Marshall County) and Sabetha USD 441 (Nemaha County) consolidated to create Prairie Hills USD 113.[14]
Communities
Cities
Census-designated place
Other unincorporated communities
Ghost towns
Townships
Marshall County is divided into twenty-five townships. The city of Marysville is considered governmentally independent and is excluded from the census figures for the townships. In the following table, the population center is the largest city (or cities) included in that township's population total, if it is of a significant size.
Notable people
- Frank Wayenberg (1898-1975) - pitcher for the Cleveland Indians in 1924.
- Butch Nieman (1918-1993) - born in Herkimer, played outfield for the Boston Braves from 1943 to 1945.
- Don Songer (1899-1962) - pitcher for the Pittsburgh Pirates from 1924 to 1927 and the New York Giants in 1927.
See also
|
|
References
- 1 2 "State & County QuickFacts". United States Census Bureau. Archived from the original on July 14, 2011. Retrieved July 27, 2014.
- ↑ "Find a County". National Association of Counties. Retrieved 2011-06-07.
- ↑ History of Kansas Vol. 2 By Andreas
- ↑ John Albert Sleicher (1883). Leslie's. F. Leslie.
- ↑ "US Gazetteer files: 2010, 2000, and 1990". United States Census Bureau. 2011-02-12. Retrieved 2011-04-23.
- ↑ "Population and Housing Unit Estimates". Retrieved June 9, 2017.
- ↑ "U.S. Decennial Census". United States Census Bureau. Retrieved July 27, 2014.
- ↑ "Historical Census Browser". University of Virginia Library. Retrieved July 27, 2014.
- ↑ "Population of Counties by Decennial Census: 1900 to 1990". United States Census Bureau. Retrieved July 27, 2014.
- ↑ "Census 2000 PHC-T-4. Ranking Tables for Counties: 1990 and 2000" (PDF). United States Census Bureau. Retrieved July 27, 2014.
- ↑ "American FactFinder". United States Census Bureau. Retrieved 2008-01-31.
- ↑ http://uselectionatlas.org/RESULTS
- ↑ "Map of Wet and Dry Counties". Alcoholic Beverage Control, Kansas Department of Revenue. November 2006. Archived from the original on 2007-10-08. Retrieved 2007-12-28.
- ↑ School consolidations in Kansas for past decade; Topeka-Capital Journal; July 24, 2011.
- ↑ "Plat book of Marshall County, Kansas" 1904. https://www.kansasmemory.org/item/209410
Further reading
- Atlas of Marshall County, Kansas; Anderson Publishing Co; 74 pages; 1922.
- Plat Book of Marshall County, Kansas; North West Publishing Co; 53 pages; 1904.
External links
| Wikimedia Commons has media related to Marshall County, Kansas. |
- County
- Historical
- Tornados
- Maps
- Marshall County Maps: Current, Historic, KDOT
- Kansas Highway Maps: Current, Historic, KDOT
- Kansas Railroad Maps: Current, 1996, 1915, KDOT and Kansas Historical Society
Places adjacent to Marshall County, Kansas | ||||||||||
|---|---|---|---|---|---|---|---|---|---|---|
| ||||||||||
Municipalities and communities of Marshall County, Kansas, United States | ||
|---|---|---|
| Cities | | |
| CDP | ||
| Unincorporated communities | ||
| Ghost towns | ||
| Townships | ||
