United States presidential election in Kansas, 2012
|
|
|
|
|
 County Results
|
Romney
40-50%
50-60%
60-70%
70-80%
80-90%
>90%
|
Obama
60-70%
|
|
|
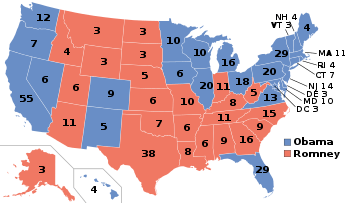
The 2012 United States presidential election in Kansas took place on November 6, 2012, as part of the 2012 General Election in which all 50 states plus The District of Columbia participated. Kansas voters chose six electors to represent them in the Electoral College via a popular vote pitting incumbent Democratic President Barack Obama and his running mate, Vice President Joe Biden, against Republican challenger and former Massachusetts Governor Mitt Romney and his running mate, Congressman Paul Ryan. Romney and Ryan carried Kansas with 59.66% of the popular vote to Obama's and Biden's 38.05%, thus winning the state's six electoral votes.[1]
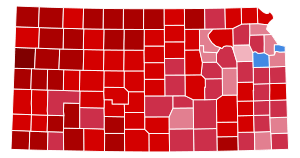
Obama carried only two counties: Douglas, home to liberal Lawrence and the University of Kansas; and Wyandotte, home to Kansas City and the state's largest concentration of nonwhite voters. In 2008, Obama also carried Crawford County in southeast Kansas, but failed to do so this time.
General Election
By county
| County |
Obama% |
Obama# |
Romney% |
Romney# |
Others% |
Others# |
Total |
| Allen County | 35.20% | 1,869 | 62.45% | 3,316 | 2.35% | 125 | 5,310 |
| Anderson County | 28.48% | 944 | 68.66% | 2,276 | 2.87% | 95 | 3,315 |
| Atchison County | 38.46% | 2,567 | 58.69% | 3,917 | 2.85% | 190 | 6,674 |
| Barber County | 20.83% | 482 | 76.58% | 1,772 | 2.59% | 60 | 2,314 |
| Barton County | 22.21% | 2,297 | 76.14% | 7,874 | 1.64% | 170 | 10,341 |
| Bourbon County | 31.92% | 1,996 | 65.59% | 4,102 | 2.49% | 156 | 6,254 |
| Brown County | 26.95% | 1,076 | 70.85% | 2,829 | 2.20% | 88 | 3,993 |
| Butler County | 27.92% | 7,282 | 69.61% | 18,157 | 2.48% | 646 | 26,085 |
| Chase County | 28.17% | 358 | 68.84% | 875 | 2.99% | 38 | 1,271 |
| Chautauqua County | 17.18% | 280 | 80.00% | 1,304 | 2.82% | 46 | 1,630 |
| Cherokee County | 34.19% | 2,930 | 63.66% | 5,456 | 2.16% | 185 | 8,571 |
| Cheyenne County | 16.34% | 233 | 81.28% | 1,159 | 2.38% | 34 | 1,426 |
| Clark County | 17.11% | 174 | 79.15% | 805 | 3.74% | 38 | 1,017 |
| Clay County | 22.63% | 834 | 75.64% | 2,788 | 1.74% | 64 | 3,686 |
| Cloud County | 24.00% | 974 | 72.79% | 2,954 | 3.20% | 130 | 4,058 |
| Coffey County | 22.99% | 898 | 74.32% | 2,903 | 2.69% | 105 | 3,906 |
| Comanche County | 15.41% | 143 | 82.65% | 767 | 1.94% | 18 | 928 |
| Cowley County | 33.98% | 4,319 | 63.58% | 8,081 | 2.44% | 310 | 12,710 |
| Crawford County | 45.67% | 6,826 | 51.58% | 7,708 | 2.75% | 411 | 14,945 |
| Decatur County | 17.36% | 266 | 79.50% | 1,218 | 3.13% | 48 | 1,532 |
| Dickinson County | 25.12% | 2,020 | 72.52% | 5,832 | 2.36% | 190 | 8,042 |
| Doniphan County | 26.51% | 902 | 70.94% | 2,414 | 2.56% | 87 | 3,403 |
| Douglas County | 60.79% | 29,267 | 36.14% | 17,401 | 3.07% | 1,477 | 48,145 |
| Edwards County | 21.52% | 298 | 76.46% | 1,059 | 2.02% | 28 | 1,385 |
| Elk County | 20.53% | 281 | 76.63% | 1,049 | 2.85% | 39 | 1,369 |
| Ellis County | 26.10% | 3,057 | 71.70% | 8,399 | 2.20% | 258 | 11,714 |
| Ellsworth County | 25.88% | 702 | 71.17% | 1,930 | 2.95% | 80 | 2,712 |
| Finney County | 29.52% | 2,682 | 68.46% | 6,219 | 2.01% | 183 | 9,084 |
| Ford County | 31.09% | 2,600 | 66.99% | 5,602 | 1.91% | 160 | 8,362 |
| Franklin County | 33.61% | 3,694 | 63.55% | 6,984 | 2.84% | 312 | 10,990 |
| Geary County | 42.47% | 3,332 | 55.73% | 4,372 | 1.80% | 141 | 7,845 |
| Gove County | 12.73% | 176 | 84.45% | 1,168 | 2.82% | 39 | 1,383 |
| Graham County | 19.10% | 256 | 78.81% | 1,056 | 2.09% | 28 | 1,340 |
| Grant County | 19.77% | 456 | 78.53% | 1,811 | 1.69% | 39 | 2,306 |
| Gray County | 16.55% | 324 | 81.87% | 1,603 | 1.58% | 31 | 1,958 |
| Greeley County | 16.87% | 113 | 81.04% | 543 | 2.09% | 14 | 670 |
| Greenwood County | 22.52% | 478 | 74.89% | 1,590 | 2.59% | 55 | 2,123 |
| Hamilton County | 18.59% | 163 | 79.02% | 693 | 2.39% | 21 | 877 |
| Harper County | 23.02% | 550 | 73.63% | 1,759 | 3.35% | 80 | 2,389 |
| Harvey County | 37.59% | 5,373 | 60.08% | 8,588 | 2.33% | 333 | 14,294 |
| Haskell County | 15.40% | 215 | 83.02% | 1,159 | 1.58% | 22 | 1,396 |
| Hodgeman County | 16.89% | 179 | 81.89% | 868 | 1.23% | 13 | 1,060 |
| Jackson County | 34.18% | 1,901 | 63.42% | 3,527 | 2.39% | 133 | 5,561 |
| Jefferson County | 37.15% | 2,977 | 60.24% | 4,827 | 2.61% | 209 | 8,013 |
| Jewell County | 15.30% | 229 | 82.50% | 1,235 | 2.20% | 33 | 1,497 |
| Johnson County | 40.18% | 110,526 | 57.58% | 158,401 | 2.23% | 6,147 | 275,074 |
| Kearny County | 19.34% | 268 | 79.15% | 1,097 | 1.52% | 21 | 1,386 |
| Kingman County | 22.69% | 733 | 74.19% | 2,397 | 3.13% | 101 | 3,231 |
| Kiowa County | 14.25% | 163 | 85.31% | 976 | .44% | 5 | 1,144 |
| Labette County | 38.78% | 3,117 | 59.00% | 4,742 | 2.21% | 178 | 8,037 |
| Lane County | 18.53% | 172 | 79.63% | 739 | 1.83% | 17 | 928 |
| Leavenworth County | 39.05% | 11,357 | 58.65% | 17,059 | 2.30% | 669 | 29,085 |
| Lincoln County | 19.49% | 289 | 78.56% | 1,165 | 1.96% | 29 | 1,483 |
| Linn County | 26.19% | 1,170 | 71.12% | 3,177 | 2.69% | 120 | 4,467 |
| Logan County | 14.59% | 197 | 83.41% | 1,126 | 2.0% | 27 | 1,350 |
| Lyon County | 43.04% | 5,111 | 54.48% | 6,470 | 2.48% | 294 | 11,875 |
| Marion County | 25.61% | 1,385 | 71.90% | 3,889 | 2.50% | 135 | 5,409 |
| Marshall County | 30.78% | 1,469 | 66.94% | 3,195 | 2.28% | 109 | 4,773 |
| McPherson County | 28.05% | 3,449 | 69.49% | 8,545 | 2.46% | 303 | 12,297 |
| Meade County | 15.10% | 258 | 83.56% | 1,428 | 1.35% | 23 | 1,709 |
| Miami County | 31.72% | 4,712 | 66.36% | 9,858 | 1.93% | 286 | 14,856 |
| Mitchell County | 19.70% | 584 | 78.48% | 2,327 | 1.82% | 54 | 2,965 |
| Montgomery County | 28.20% | 3,501 | 69.50% | 8,630 | 2.30% | 286 | 12,417 |
| Morris County | 28.02% | 718 | 69.20% | 1,773 | 2.77% | 71 | 2,562 |
| Morton County | 14.79% | 189 | 83.88% | 1,072 | 1.33% | 17 | 1,278 |
| Nemaha County | 19.90% | 1,000 | 78.19% | 3,930 | 1.91% | 96 | 5,026 |
| Neosho County | 31.64% | 2,050 | 65.93% | 4,272 | 2.44% | 158 | 6,480 |
| Ness County | 15.10% | 218 | 83.73% | 1,209 | 1.18% | 17 | 1,444 |
| Norton County | 17.12% | 398 | 80.77% | 1,878 | 2.11% | 49 | 2,325 |
| Osage County | 32.84% | 2,268 | 64.10% | 4,427 | 3.06% | 211 | 6,906 |
| Osborne County | 17.63% | 324 | 80.47% | 1,479 | 1.90% | 35 | 1,838 |
| Ottawa County | 19.02% | 558 | 78.25% | 2,295 | 2.73% | 80 | 2,933 |
| Pawnee County | 27.53% | 718 | 70.40% | 1,836 | 2.07% | 54 | 2,608 |
| Phillips County | 14.89% | 382 | 83.24% | 2,135 | 1.87% | 48 | 2,565 |
| Pottawatomie County | 24.63% | 2,335 | 71.78% | 6,804 | 3.59% | 340 | 9,479 |
| Pratt County | 25.78% | 980 | 72.90% | 2,771 | 1.32% | 50 | 3,801 |
| Rawlins County | 13.16% | 190 | 84.70% | 1,223 | 2.15% | 31 | 1,444 |
| Reno County | 33.11% | 8,085 | 64.36% | 15,718 | 2.53% | 619 | 24,422 |
| Republic County | 17.76% | 477 | 79.45% | 2,134 | 2.79% | 75 | 2,686 |
| Rice County | 24.75% | 911 | 72.70% | 2,676 | 2.55% | 94 | 3,681 |
| Riley County | 42.54% | 8,977 | 54.53% | 11,507 | 2.92% | 617 | 21,101 |
| Rooks County | 14.67% | 361 | 82.85% | 2,038 | 2.48% | 61 | 2,460 |
| Rush County | 23.38% | 367 | 74.27% | 1,166 | 2.36% | 37 | 1,570 |
| Russell County | 18.53% | 593 | 79.78% | 2,553 | 1.69% | 54 | 3,200 |
| Saline County | 32.75% | 7,040 | 64.38% | 13,840 | 2.87% | 616 | 21,496 |
| Scott County | 13.50% | 277 | 84.21% | 1,728 | 2.29% | 47 | 2,052 |
| Sedgwick County | 40.13% | 71,977 | 59.38% | 106,506 | .50% | 891 | 179,374 |
| Seward County | 28.79% | 1,490 | 69.88% | 3,617 | 1.33% | 69 | 5,176 |
| Shawnee County | 48.33% | 36,975 | 49.38% | 37,782 | 2.29% | 1,754 | 76,511 |
| Sheridan County | 12.52% | 168 | 85.99% | 1,154 | 1.49% | 20 | 1,342 |
| Sherman County | 22.00% | 577 | 75.33% | 1,976 | 2.67% | 70 | 2,623 |
| Smith County | 17.70% | 358 | 80.28% | 1,624 | 2.03% | 41 | 2,023 |
| Stafford County | 21.97% | 404 | 75.31% | 1,385 | 2.72% | 50 | 1,839 |
| Stanton County | 18.84% | 143 | 79.71% | 605 | 1.45% | 11 | 759 |
| Stevens County | 12.39% | 252 | 85.99% | 1,749 | 1.62% | 33 | 2,034 |
| Sumner County | 29.08% | 2,658 | 68.48% | 6,260 | 2.44% | 223 | 9,141 |
| Thomas County | 17.21% | 598 | 80.25% | 2,788 | 2.53% | 88 | 3,474 |
| Trego County | 18.43% | 291 | 79.86% | 1,261 | 1.71% | 27 | 1,579 |
| Wabaunsee County | 28.10% | 918 | 69.05% | 2,256 | 2.85% | 93 | 3,267 |
| Wallace County | 08.52% | 68 | 90.10% | 719 | 1.38% | 11 | 798 |
| Washington County | 18.14% | 524 | 80.17% | 2,316 | 1.70% | 49 | 2,889 |
| Wichita County | 15.91% | 157 | 83.18% | 821 | .91% | 9 | 987 |
| Wilson County | 22.01% | 818 | 76.00% | 2,825 | 1.99% | 74 | 3,717 |
| Woodson County | 26.26% | 380 | 71.53% | 1,035 | 2.21% | 32 | 1,447 |
| Wyandotte County | 67.61% | 34,302 | 30.54% | 15,496 | 1.85% | 940 | 50,738 |
Democratic caucuses
[Data unknown/missing.]
Republican caucuses
Kansas Republican caucuses, 2017 kora
|
| March 10, 2012 (2012-03-10) |
|
|
|
 Kansas results by county
Rick Santorum
Mitt Romney
No votes |
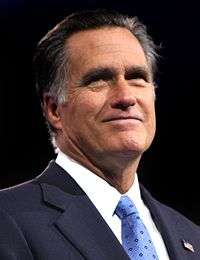
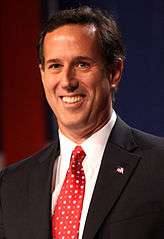
The Republican caucuses were held on Saturday, March 10, 2012.[2][3] Kansas has 40 delegates to the 2012 Republican National Convention. 25 of these delegates are allocated proportionally to candidates who exceed a 20% threshold in the statewide vote tally. The 15 remaining delegates are 'winner-take-all' delegates. 12 delegates are given (3 each) to the candidates with most votes in each of Kansas's 4 congressional districts. 3 delegates are awarded to the candidate with most votes statewide.[4]
Rick Santorum won the caucus and will receive 33 delegates. He won the state with 51% of the statewide vote and received most votes in all of the congressional districts, thus winning 15 delegates. As only Santorum and Mitt Romney exceeded the 20% threshold, 18 of the 25 proportionally allocated delegates were allocated to Santorum and 7 to Romney.
| Key: | Withdrew
prior to contest |
External links
|
|---|
| Election timelines | |
|---|
| National polling | |
|---|
| State polling | |
|---|
| Fundraising | |
|---|
| Debates and forums | |
|---|
| Straw polls | |
|---|
| Major events | |
|---|
Caucuses
and primaries | |
|---|
| Results breakdown | |
|---|
National
conventions | |
|---|
| Reforms | |
|---|