Phillips County, Kansas
| Phillips County, Kansas | |
|---|---|
| County | |
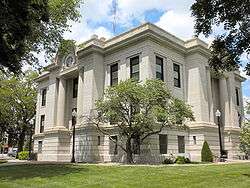 Phillips County Courthouse in Phillipsburg | |
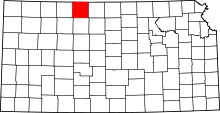 Location in the U.S. state of Kansas | |
 Kansas's location in the U.S. | |
| Founded | February 26, 1867 |
| Named for | William A. Phillips |
| Seat | Phillipsburg |
| Largest city | Phillipsburg |
| Area | |
| • Total | 895 sq mi (2,318 km2) |
| • Land | 886 sq mi (2,295 km2) |
| • Water | 8.7 sq mi (23 km2), 1.0% |
| Population (est.) | |
| • (2016) | 5,428 |
| • Density | 6.4/sq mi (2.5/km2) |
| Congressional district | 1st |
| Time zone | Central: UTC−6/−5 |
| Website | County website |
Phillips County (standard abbreviation: PL) is a county located in the U.S. state of Kansas. As of the 2010 census, the county population was 5,642.[1] The largest city and county seat is Phillipsburg.[2]
History
Early history
For many millennia, the Great Plains of North America was inhabited by nomadic Native Americans. From the 16th century to 18th century, the Kingdom of France claimed ownership of large parts of North America. In 1762, after the French and Indian War, France secretly ceded New France to Spain, per the Treaty of Fontainebleau.
19th century
In 1802, Spain returned most of the land to France, but keeping title to about 7,500 square miles. In 1803, most of the land for modern day Kansas was acquired by the United States from France as part of the 828,000 square mile Louisiana Purchase for 2.83 cents per acre.
In 1854, the Kansas Territory was organized, then in 1861 Kansas became the 34th U.S. state. In 1867, Phillips County was established.
Geography
According to the U.S. Census Bureau, the county has a total area of 895 square miles (2,320 km2), of which 886 square miles (2,290 km2) is land and 8.7 square miles (23 km2) (1.0%) is water.[3]
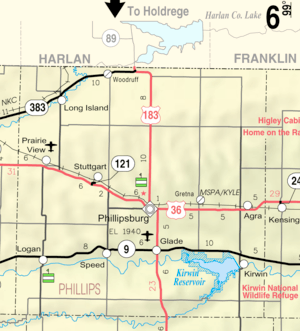
Adjacent counties
- Harlan County, Nebraska (north)
- Franklin County, Nebraska (northeast)
- Smith County (east)
- Rooks County (south)
- Graham County (southwest)
- Norton County (west)
National protected area
Demographics
| Historical population | |||
|---|---|---|---|
| Census | Pop. | %± | |
| 1880 | 12,014 | — | |
| 1890 | 13,661 | 13.7% | |
| 1900 | 14,442 | 5.7% | |
| 1910 | 14,150 | −2.0% | |
| 1920 | 12,505 | −11.6% | |
| 1930 | 12,159 | −2.8% | |
| 1940 | 10,435 | −14.2% | |
| 1950 | 9,273 | −11.1% | |
| 1960 | 8,709 | −6.1% | |
| 1970 | 7,888 | −9.4% | |
| 1980 | 7,406 | −6.1% | |
| 1990 | 6,590 | −11.0% | |
| 2000 | 6,001 | −8.9% | |
| 2010 | 5,642 | −6.0% | |
| Est. 2016 | 5,428 | [4] | −3.8% |
| U.S. Decennial Census[5] 1790-1960[6] 1900-1990[7] 1990-2000[8] 2010-2016[1] | |||
As of the census[9] of 2000, there were 6,001 people, 2,496 households, and 1,722 families residing in the county. The population density was 7 people per square mile (3/km²). There were 3,088 housing units at an average density of 4 per square mile (1/km²). The racial makeup of the county was 98.25% White, 0.25% Black or African American, 0.30% Native American, 0.45% Asian, 0.03% from other races, and 0.72% from two or more races. 0.67% of the population were Hispanic or Latino of any race.
There were 2,496 households out of which 28.30% had children under the age of 18 living with them, 61.50% were married couples living together, 5.50% had a female householder with no husband present, and 31.00% were non-families. 28.60% of all households were made up of individuals and 15.80% had someone living alone who was 65 years of age or older. The average household size was 2.35 and the average family size was 2.89.
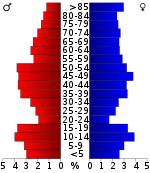
In the county, the population was spread out with 24.50% under the age of 18, 5.70% from 18 to 24, 23.20% from 25 to 44, 24.80% from 45 to 64, and 21.80% who were 65 years of age or older. The median age was 42 years. For every 100 females there were 94.80 males. For every 100 females age 18 and over, there were 91.20 males.
The median income for a household in the county was $35,013, and the median income for a family was $41,638. Males had a median income of $29,609 versus $17,827 for females. The per capita income for the county was $17,121. About 7.20% of families and 10.00% of the population were below the poverty line, including 11.60% of those under age 18 and 8.80% of those age 65 or over.
Government
Presidential elections
| Year | Republican | Democratic | Third Parties |
|---|---|---|---|
| 2016 | 83.8% 2,233 | 11.3% 300 | 4.9% 131 |
| 2012 | 83.2% 2,135 | 14.9% 382 | 1.9% 48 |
| 2008 | 78.9% 2,105 | 19.7% 525 | 1.4% 37 |
| 2004 | 79.2% 2,256 | 19.6% 557 | 1.2% 34 |
| 2000 | 73.7% 2,057 | 21.9% 611 | 4.4% 124 |
| 1996 | 66.3% 2,005 | 25.1% 758 | 8.6% 261 |
| 1992 | 46.6% 1,579 | 24.9% 843 | 28.5% 966 |
| 1988 | 69.9% 2,316 | 29.0% 960 | 1.2% 39 |
| 1984 | 80.9% 2,813 | 18.0% 626 | 1.1% 38 |
| 1980 | 74.5% 2,731 | 20.4% 748 | 5.1% 188 |
| 1976 | 63.1% 2,317 | 34.4% 1,264 | 2.6% 94 |
| 1972 | 76.2% 2,919 | 21.6% 827 | 2.3% 87 |
| 1968 | 68.3% 2,567 | 22.5% 844 | 9.3% 348 |
| 1964 | 54.1% 2,164 | 45.1% 1,804 | 0.8% 32 |
| 1960 | 75.3% 3,123 | 24.2% 1,004 | 0.4% 18 |
| 1956 | 75.5% 3,117 | 23.9% 985 | 0.7% 27 |
| 1952 | 80.2% 3,713 | 19.1% 884 | 0.7% 34 |
| 1948 | 66.3% 2,715 | 29.9% 1,223 | 3.8% 156 |
| 1944 | 72.7% 3,053 | 26.2% 1,098 | 1.1% 46 |
| 1940 | 69.5% 3,676 | 29.6% 1,563 | 1.0% 51 |
| 1936 | 59.6% 3,193 | 40.2% 2,154 | 0.2% 11 |
| 1932 | 40.6% 2,165 | 56.5% 3,007 | 2.9% 155 |
| 1928 | 69.8% 3,206 | 29.0% 1,332 | 1.2% 57 |
| 1924 | 55.0% 2,647 | 28.6% 1,376 | 16.5% 792 |
| 1920 | 68.6% 2,862 | 29.5% 1,230 | 1.9% 80 |
| 1916 | 41.8% 2,271 | 53.7% 2,912 | 4.5% 245 |
| 1912 | 18.7% 594 | 39.6% 1,257 | 41.7% 1,324[lower-alpha 1] |
| 1908 | 52.3% 1,762 | 44.2% 1,490 | 3.6% 120 |
| 1904 | 66.4% 2,147 | 25.1% 811 | 8.5% 275 |
| 1900 | 52.3% 1,691 | 46.7% 1,511 | 1.1% 34 |
| 1896 | 47.2% 1,374 | 51.8% 1,507 | 1.0% 28 |
| 1892 | 47.8% 1,352 | 52.2% 1,477 | |
| 1888 | 53.9% 1,681 | 24.5% 763 | 21.7% 677 |
Phillips County is overwhelmingly Republican. No Democratic Presidential candidate has won Phillips County since Franklin D. Roosevelt in 1932, and since 1936 only two Democrats have obtained 41 percent of the county’s vote: Lyndon Johnson in 1964 and Jimmy Carter in 1976.
Laws
Following amendment to the Kansas Constitution in 1986, the county remained a prohibition, or "dry", county until 1996, when voters approved the sale of alcoholic liquor by the individual drink with a 30 percent food sales requirement.[11]
Education
Unified school districts
- Thunder Ridge USD 110 (Consolidation of Agra-Eastern Heights and Kensington-West Smith County)
- Agra and small eastern portion of county; extends into western third of Smith County
- Northern Valley USD 212
- Long Island and northwestern corner of county; extends into northeastern Norton County
- Phillipsburg USD 325
- Logan USD 326
- southwestern corner of county; extends into southeastern Norton County
Communities
Cities
Unincorporated communities
Townships
Phillips County is divided into twenty-five townships. The city of Phillipsburg is considered governmentally independent and is excluded from the census figures for the townships. In the following table, the population center is the largest city (or cities) included in that township's population total, if it is of a significant size.
See also
|
|
References
- 1 2 "State & County QuickFacts". United States Census Bureau. Archived from the original on July 16, 2011. Retrieved July 28, 2014.
- ↑ "Find a County". National Association of Counties. Retrieved 2011-06-07.
- ↑ "US Gazetteer files: 2010, 2000, and 1990". United States Census Bureau. 2011-02-12. Retrieved 2011-04-23.
- ↑ "Population and Housing Unit Estimates". Retrieved June 9, 2017.
- ↑ "U.S. Decennial Census". United States Census Bureau. Retrieved July 28, 2014.
- ↑ "Historical Census Browser". University of Virginia Library. Retrieved July 28, 2014.
- ↑ "Population of Counties by Decennial Census: 1900 to 1990". United States Census Bureau. Retrieved July 28, 2014.
- ↑ "Census 2000 PHC-T-4. Ranking Tables for Counties: 1990 and 2000" (PDF). United States Census Bureau. Retrieved July 28, 2014.
- ↑ "American FactFinder". United States Census Bureau. Retrieved 2008-01-31.
- ↑ http://uselectionatlas.org/RESULTS
- ↑ "Map of Wet and Dry Counties". Alcoholic Beverage Control, Kansas Department of Revenue. November 2006. Archived from the original on 2007-10-08. Retrieved 2007-12-26.
- Notes
- ↑ This total comprises 1,181 votes (37.2%) for Progressive Theodore Roosevelt and 105 votes (4.3%) for Socialist Eugene V. Debs.
Further reading
- Standard Atlas of Phillips County, Kansas; Geo. A. Ogle & Co; 78 pages; 1917.
- Plat Book of Phillips County, Kansas; North West Publishing Co; 49 pages; 1900.
External links
| Wikimedia Commons has media related to Phillips County, Kansas. |
- County
- Phillips County - Official Website
- Phillips County - Directory of Public Officials
- Phillips County - Economic Development
- Maps
- Phillips County Maps: Current, Historic, KDOT
- Kansas Highway Maps: Current, Historic, KDOT
- Kansas Railroad Maps: Current, 1996, 1915, KDOT and Kansas Historical Society
Places adjacent to Phillips County, Kansas | |
|---|---|
Municipalities and communities of Phillips County, Kansas, United States | ||
|---|---|---|
| Cities | | |
| Unincorporated communities | ||
| Ghost towns | ||
