Harper County, Kansas
| Harper County, Kansas | |
|---|---|
| County | |
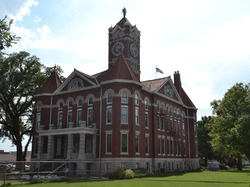 Harper County Courthouse (2015) | |
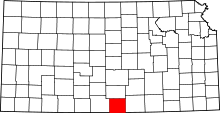 Location in the U.S. state of Kansas | |
 Kansas's location in the U.S. | |
| Founded | February 26, 1867 |
| Named for | Marion Harper |
| Seat | Anthony |
| Largest city | Anthony |
| Area | |
| • Total | 803 sq mi (2,080 km2) |
| • Land | 801 sq mi (2,075 km2) |
| • Water | 1.5 sq mi (4 km2), 0.2% |
| Population (est.) | |
| • (2016) | 5,685 |
| • Density | 7.5/sq mi (2.9/km2) |
| Congressional district | 4th |
| Time zone | Central: UTC−6/−5 |
| Website | HarperCountyKS.gov |
Harper County (county code HP) is a county located in the U.S. state of Kansas. As of the 2010 census, the county population was 6,034.[1] Its county seat and most populous city is Anthony.[2] The county was named for Sergeant Marion Harper of the 2nd Kansas Cavalry, who died of wounds suffered near Waldron, Arkansas, in December 1863.[3]
History
Early history
For many millennia, the Great Plains of North America was inhabited by nomadic Native Americans. From the 16th century to 18th century, the Kingdom of France claimed ownership of large parts of North America. In 1762, after the French and Indian War, France secretly ceded New France to Spain, per the Treaty of Fontainebleau.
19th century
In 1802, Spain returned most of the land to France, but keeping title to about 7,500 square miles. In 1803, most of the land for modern day Kansas was acquired by the United States from France as part of the 828,000 square mile Louisiana Purchase for 2.83 cents per acre.
In 1854, the Kansas Territory was organized, then in 1861 Kansas became the 34th U.S. state. In 1867, Harper County was established.
The original organization of Harper County was one of the largest frauds in county government. In 1873, a group of three men organized Harper County, designating the then fictitious city of "Bluff City" as the county seat. The petition for organization used several names out of a Cincinnati city directory to represent as residents of Harper County.[4] In 1874, the state attorney general investigated, and found not a single resident of the county. The "founders" of the county had sold $40,000 worth of bonds.[5]
Harper County was settled starting in 1877, and the county was organized for a second time in 1878 by the Glenn and Robinson families. Since Bluff City could not be shown to have existed, Anthony was designated as the temporary county seat. In an election in 1879, Anthony won as county seat even though 2,960 votes were cast in a county with 800 legal voters.[5]
21st century
Due to new and high-paying jobs at area oil fields and wind farms, Harper County experienced an economic boom; as of 2012, rental housing and office space in towns such as Danville, Harper, and Anthony had more than quadrupled in price, in properties ranging from double-wide trailers to a Carnegie library.[6] However, by 2016, the oil fracking boom had largely played out and the economies of Harper and adjacent counties suffered under the impact.[7] Earthquakes, due to induced seismicity from injection wells, had also substantially reduced in frequency and intensity, thanks to a Kansas Corporation Commission order mandating cutbacks in volumes and pressures. SandRidge Energy, which along with Chesapeake Energy was one of the two major producers in Harper county, appealed the order, but soon went into bankruptcy.[8][9][10]
Geography
According to the U.S. Census Bureau, the county has a total area of 803 square miles (2,080 km2), of which 801 square miles (2,070 km2) is land and 1.5 square miles (3.9 km2) (0.2%) is water.[11]
Adjacent counties
- Kingman County (north)
- Sumner County (east)
- Grant County, Oklahoma (southeast)
- Alfalfa County, Oklahoma (southwest)
- Barber County (west)
Demographics
| Historical population | |||
|---|---|---|---|
| Census | Pop. | %± | |
| 1880 | 4,133 | — | |
| 1890 | 13,266 | 221.0% | |
| 1900 | 10,310 | −22.3% | |
| 1910 | 14,748 | 43.0% | |
| 1920 | 13,656 | −7.4% | |
| 1930 | 12,823 | −6.1% | |
| 1940 | 12,068 | −5.9% | |
| 1950 | 10,263 | −15.0% | |
| 1960 | 9,541 | −7.0% | |
| 1970 | 7,871 | −17.5% | |
| 1980 | 7,778 | −1.2% | |
| 1990 | 7,124 | −8.4% | |
| 2000 | 6,536 | −8.3% | |
| 2010 | 6,034 | −7.7% | |
| Est. 2016 | 5,685 | [12] | −5.8% |
| U.S. Decennial Census[13] 1790-1960[14] 1900-1990[15] 1990-2000[16] 2010-2016[1] | |||
As of the 2000 census,[17] there were 6,536 people, 2,773 households, and 1,807 families residing in the county. The population density was 8 people per square mile (3/km²). There were 3,270 housing units at an average density of 4 per square mile (2/km²). The racial makeup of the county was 97.23% White, 0.83% Native American, 0.23% Black or African American, 0.14% Asian, 0.02% Pacific Islander, 0.38% from other races, and 1.18% from two or more races. Hispanic or Latino of any race were 1.07% of the population.
There were 2,773 households out of which 27.70% had children under the age of 18 living with them, 55.30% were married couples living together, 6.90% had a female householder with no husband present, and 34.80% were non-families. 32.10% of all households were made up of individuals and 17.90% had someone living alone who was 65 years of age or older. The average household size was 2.30 and the average family size was 2.90.
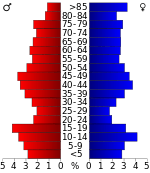
In the county, the population was spread out with 24.70% under the age of 18, 6.60% from 18 to 24, 22.00% from 25 to 44, 23.50% from 45 to 64, and 23.20% who were 65 years of age or older. The median age was 43 years. For every 100 females there were 93.70 males. For every 100 females age 18 and over, there were 91.40 males.
The median income for a household in the county was $29,776, and the median income for a family was $39,866. Males had a median income of $27,869 versus $20,000 for females. The per capita income for the county was $16,368. About 8.50% of families and 11.60% of the population were below the poverty line, including 15.70% of those under age 18 and 7.70% of those age 65 or over.
Government
Presidential elections
| Year | Republican | Democratic | Third Parties |
|---|---|---|---|
| 2016 | 77.4% 1,996 | 15.2% 393 | 7.3% 189 |
| 2012 | 73.6% 1,759 | 23.0% 550 | 3.4% 80 |
| 2008 | 71.5% 1,999 | 26.3% 736 | 2.2% 61 |
| 2004 | 73.5% 2,154 | 24.8% 727 | 1.7% 49 |
| 2000 | 68.0% 2,076 | 28.5% 869 | 3.6% 110 |
| 1996 | 61.4% 1,941 | 26.5% 836 | 12.1% 382 |
| 1992 | 40.6% 1,371 | 25.0% 845 | 34.4% 1,162 |
| 1988 | 59.4% 1,941 | 37.8% 1,235 | 2.8% 92 |
| 1984 | 73.1% 2,521 | 25.9% 893 | 1.0% 35 |
| 1980 | 64.2% 2,254 | 28.2% 990 | 7.6% 268 |
| 1976 | 50.0% 1,777 | 47.3% 1,681 | 2.7% 96 |
| 1972 | 75.7% 2,628 | 21.0% 729 | 3.3% 114 |
| 1968 | 64.0% 2,351 | 27.6% 1,015 | 8.4% 308 |
| 1964 | 51.7% 1,969 | 47.6% 1,813 | 0.7% 28 |
| 1960 | 68.3% 3,158 | 31.1% 1,439 | 0.5% 25 |
| 1956 | 70.0% 3,111 | 29.5% 1,311 | 0.5% 23 |
| 1952 | 78.6% 3,575 | 20.4% 927 | 1.0% 45 |
| 1948 | 59.3% 2,702 | 38.4% 1,752 | 2.3% 106 |
| 1944 | 63.8% 2,849 | 35.2% 1,573 | 1.0% 46 |
| 1940 | 55.7% 3,205 | 43.1% 2,478 | 1.2% 68 |
| 1936 | 41.7% 2,441 | 57.9% 3,391 | 0.4% 22 |
| 1932 | 41.1% 2,116 | 55.6% 2,860 | 3.3% 169 |
| 1928 | 77.9% 3,712 | 21.1% 1,005 | 1.1% 51 |
| 1924 | 53.3% 2,280 | 30.9% 1,321 | 15.9% 681 |
| 1920 | 61.7% 2,593 | 35.3% 1,486 | 3.0% 127 |
| 1916 | 36.8% 1,797 | 54.2% 2,648 | 9.0% 439 |
| 1912 | 11.6% 365 | 40.6% 1,274 | 47.8% 1,499[lower-alpha 1] |
| 1908 | 48.5% 1,490 | 45.7% 1,404 | 5.9% 181 |
| 1904 | 61.7% 1,459 | 25.3% 597 | 13.0% 308 |
| 1900 | 47.0% 1,190 | 49.8% 1,261 | 3.1% 79 |
| 1896 | 37.4% 812 | 61.3% 1,332 | 1.3% 29 |
| 1892 | 38.6% 1,288 | 61.4% 2,051 | |
| 1888 | 48.8% 1,490 | 30.8% 940 | 20.4% 624 |
Laws
Following amendment to the Kansas Constitution in 1986, Harper County remained a prohibition, or "dry", county until 2006, when voters approved the sale of alcoholic liquor by the individual drink with a 30% food sales requirement.[19]
Education
Unified school districts
Communities

Cities
Unincorporated communities
Ghost Towns
- Albion
- Crisfield
- Midway
- Ruella
- Shook
- Yankton
Townships
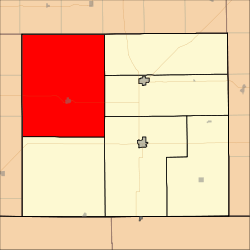
Harper County is divided into six townships. The cities of Anthony and Harper are considered governmentally independent and are excluded from the census figures for the townships. In the following table, the population center is the largest city (or cities) included in that township's population total, if it is of a significant size.
Harper County is one of only four counties in Kansas that have numbered, not named, townships. The other three are Morris County, Pratt County, and Rooks County.
| Township | FIPS | Population center |
Population | Population density /km² (/sq mi) |
Land area km² (sq mi) | Water area km² (sq mi) | Water % | Geographic coordinates |
|---|---|---|---|---|---|---|---|---|
| Township 1 | 71201 | 1,000 | 2 (6) | 468 (181) | 1 (0) | 0.12% | 37°15′23″N 98°14′0″W / 37.25639°N 98.23333°W | |
| Township 2 | 71205 | 144 | 0 (1) | 363 (140) | 1 (0) | 0.23% | 37°4′23″N 98°14′22″W / 37.07306°N 98.23944°W | |
| Township 3 | 71209 | 394 | 1 (3) | 383 (148) | 2 (1) | 0.44% | 37°7′58″N 98°2′7″W / 37.13278°N 98.03528°W | |
| Township 4 | 71213 | 232 | 1 (2) | 297 (115) | 0 (0) | 0.06% | 37°7′2″N 97°51′45″W / 37.11722°N 97.86250°W | |
| Township 5 | 71217 | 463 | 2 (4) | 277 (107) | 0 (0) | 0.16% | 37°15′47″N 97°56′23″W / 37.26306°N 97.93972°W | |
| Township 6 | 71221 | 296 | 1 (3) | 280 (108) | 0 (0) | 0.06% | 37°20′26″N 97°58′17″W / 37.34056°N 97.97139°W | |
| Sources: "Census 2000 U.S. Gazetteer Files". U.S. Census Bureau, Geography Division. Archived from the original on 2002-08-02. | ||||||||
See also
|
|
References
- 1 2 "State & County QuickFacts". United States Census Bureau. Archived from the original on July 11, 2011. Retrieved July 26, 2014.
- ↑ "Find a County". National Association of Counties. Retrieved 2011-06-07.
- ↑ Kansas Place-Names, John Rydjord, University of Oklahoma Press, 1972, ISBN 0-8061-0994-7
- ↑ Blackmar, Frank Wilson (1912). Kansas: A Cyclopedia of State History, Embracing Events, Institutions, Industries, Counties, Cities, Towns, Prominent Persons, Etc.
- 1 2 Cutler, William G. (1883). History of the State of Kansas. A.T. Andreas.
- ↑ Blake Ellis (June 1, 2012). "Where trailer homes rent for $2,000 a month". CNN Money. CNN.com. Retrieved 2012-06-02.
- ↑ Downward flow's ripples: Oil, gas downturn hitting counties on many levels, Kansas Agland, Amy Bickel, Feb 13, 2016. Retrieved 26 March 2017.
- ↑ Fracking divides small town of Anthony, Kansas, University Daily Kansan, Rebecca Dowd, Jul 12, 2015. Retrieved 26 March 2017.
- ↑ Increasing Number Of Earthquakes Prompts New Regulations In Kansas, Oklahoma Oil Industries, KMUW, Abigail Beckman, January 11, 2016. Retrieved 26 March 2017.
- ↑ SandRidge Energy emerges from bankruptcy, The Oklahoman, Adam Wilmoth, October 4, 2016. Retrieved 26 March 2017.
- ↑ "US Gazetteer files: 2010, 2000, and 1990". United States Census Bureau. 2011-02-12. Retrieved 2011-04-23.
- ↑ "Population and Housing Unit Estimates". Retrieved June 9, 2017.
- ↑ "U.S. Decennial Census". United States Census Bureau. Retrieved July 26, 2014.
- ↑ "Historical Census Browser". University of Virginia Library. Retrieved July 26, 2014.
- ↑ "Population of Counties by Decennial Census: 1900 to 1990". United States Census Bureau. Retrieved July 26, 2014.
- ↑ "Census 2000 PHC-T-4. Ranking Tables for Counties: 1990 and 2000" (PDF). United States Census Bureau. Retrieved July 26, 2014.
- ↑ "American FactFinder". United States Census Bureau. Retrieved 2008-01-31.
- ↑ http://uselectionatlas.org/RESULTS
- ↑ "Map of Wet and Dry Counties". Alcoholic Beverage Control, Kansas Department of Revenue. November 2006. Archived from the original on 2007-10-08. Retrieved 2007-12-26.
- Notes
- ↑ This total comprises 1,296 votes (41.30 percent) for Progressive Theodore Roosevelt (who carried the county) and 203 votes (6.47 percent) for Socialist Eugene V. Debs.
Further reading
- Standard Atlas of Harper County, Kansas; Geo. A. Ogle & Co; 75 pages; 1919.
- Standard Atlas of Harper County, Kansas; Geo. A. Ogle & Co; 54 pages; 1902.
External links
| Wikimedia Commons has media related to Harper County, Kansas. |
- County
- Harper County - Official
- Harper County - Directory of Public Officials
- Harper County - Economic Development Council
- Maps
- Harper County Maps: Current, Historic, KDOT
- Kansas Highway Maps: Current, Historic, KDOT
- Kansas Railroad Maps: Current, 1996, 1915, KDOT and Kansas Historical Society
Places adjacent to Harper County, Kansas | ||||||||||
|---|---|---|---|---|---|---|---|---|---|---|
| ||||||||||
Municipalities and communities of Harper County, Kansas, United States | ||
|---|---|---|
| Cities | | |
| Unincorporated communities | ||
| Townships | ||
| Ghost town | ||
