Reno County, Kansas
| Reno County, Kansas | |
|---|---|
| County | |
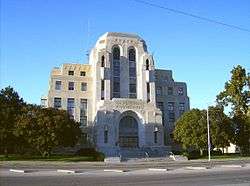 Reno County Courthouse in Hutchinson | |
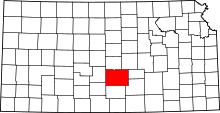 Location in the U.S. state of Kansas | |
 Kansas's location in the U.S. | |
| Founded | February 26, 1867 |
| Named for | Jesse Lee Reno |
| Seat | Hutchinson |
| Largest city | Hutchinson |
| Area | |
| • Total | 1,272 sq mi (3,294 km2) |
| • Land | 1,255 sq mi (3,250 km2) |
| • Water | 17 sq mi (44 km2), 1.3% |
| Population (est.) | |
| • (2016) | 63,220 |
| • Density | 51/sq mi (20/km2) |
| Congressional district | 1st |
| Time zone | Central: UTC−6/−5 |
| Website | RenoGov.org |
Reno County (standard abbreviation: RN) is a county located in the U.S. state of Kansas. As of the 2010 census, the population was 64,511.[1] The largest city and county seat is Hutchinson.[2]
History
Early history
For many millennia, the Great Plains of North America was inhabited by nomadic Native Americans. From the 16th century to 18th century, the Kingdom of France claimed ownership of large parts of North America. In 1762, after the French and Indian War, France secretly ceded New France to Spain, per the Treaty of Fontainebleau.
19th century
In 1802, Spain returned most of the land to France, but keeping title to about 7,500 square miles. In 1803, most of the land for modern day Kansas was acquired by the United States from France as part of the 828,000 square mile Louisiana Purchase for 2.83 cents per acre.
In 1854, the Kansas Territory was organized, then in 1861 Kansas became the 34th U.S. state. In 1867, Reno County was established.
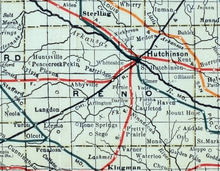
In 1887, the Chicago, Kansas and Nebraska Railway extended its main line from Herington to Pratt.[3] This main line connected Herington, Ramona, Tampa, Durham, Waldeck, Canton, Galva, McPherson, Groveland, Inman, Medora, Hutchinson, Whiteside, Partridge, Arlington, Langdon, Turon, Preston, Natrona, Pratt. In 1888, this main line was extended to Liberal. Later, this line was extended to Tucumcari, New Mexico and El Paso, Texas. This line is called the "Golden State Limited".
Geography
According to the U.S. Census Bureau, the county has a total area of 1,272 square miles (3,290 km2), of which 1,255 square miles (3,250 km2) is land and 17 square miles (44 km2) (1.3%) is water.[4] It is the third-largest county by area in Kansas.
Adjacent counties
- Rice County (north)
- McPherson County (northeast)
- Harvey County (east)
- Sedgwick County (southeast)
- Kingman County (south)
- Pratt County (southwest)
- Stafford County (west)
National protected area
Demographics
| Historical population | |||
|---|---|---|---|
| Census | Pop. | %± | |
| 1880 | 12,826 | — | |
| 1890 | 27,079 | 111.1% | |
| 1900 | 29,027 | 7.2% | |
| 1910 | 37,853 | 30.4% | |
| 1920 | 44,423 | 17.4% | |
| 1930 | 47,785 | 7.6% | |
| 1940 | 52,165 | 9.2% | |
| 1950 | 54,058 | 3.6% | |
| 1960 | 59,055 | 9.2% | |
| 1970 | 60,765 | 2.9% | |
| 1980 | 64,983 | 6.9% | |
| 1990 | 62,389 | −4.0% | |
| 2000 | 64,790 | 3.8% | |
| 2010 | 64,511 | −0.4% | |
| Est. 2016 | 63,220 | [5] | −2.0% |
| U.S. Decennial Census[6] 1790-1960[7] 1900-1990[8] 1990-2000[9] 2010-2016[1] | |||
The Hutchinson Micropolitan Statistical Area includes all of Reno County.
As of the census[10] of 2000, there were 64,790 people, 25,498 households, and 17,313 families residing in the county. The population density was 52 people per square mile (20/km²). There were 27,625 housing units at an average density of 22 per square mile (8/km²). The racial makeup of the county was 91.56% White, 2.88% Black or African American, 0.58% Native American, 0.45% Asian, 0.04% Pacific Islander, 2.69% from other races, and 1.81% from two or more races. 5.65% of the population were Hispanic or Latino of any race.
There were 25,498 households out of which 30.30% had children under the age of 18 living with them, 55.90% were married couples living together, 8.70% had a female householder with no husband present, and 32.10% were non-families. 27.90% of all households were made up of individuals and 12.10% had someone living alone who was 65 years of age or older. The average household size was 2.41 and the average family size was 2.94.
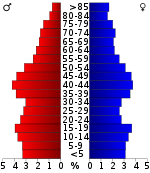
In the county, the population was spread out with 24.50% under the age of 18, 9.30% from 18 to 24, 26.90% from 25 to 44, 22.90% from 45 to 64, and 16.40% who were 65 years of age or older. The median age was 38 years. For every 100 females there were 100.90 males. For every 100 females age 18 and over, there were 99.00 males.
The median income for a household in the county was $35,510, and the median income for a family was $42,643. Males had a median income of $31,495 versus $21,329 for females. The per capita income for the county was $18,520. About 8.10% of families and 10.90% of the population were below the poverty line, including 13.90% of those under age 18 and 8.50% of those age 65 or over.
Government
Presidential elections
| Year | Republican | Democratic | Third Parties |
|---|---|---|---|
| 2016 | 63.2% 15,513 | 27.9% 6,837 | 8.9% 2,186 |
| 2012 | 64.4% 15,718 | 33.1% 8,085 | 2.5% 619 |
| 2008 | 60.6% 16,112 | 37.3% 9,916 | 2.2% 574 |
| 2004 | 65.0% 17,748 | 33.4% 9,114 | 1.7% 462 |
| 2000 | 59.7% 15,179 | 35.5% 9,025 | 4.8% 1,226 |
| 1996 | 54.3% 14,275 | 34.6% 9,108 | 11.1% 2,917 |
| 1992 | 40.1% 11,377 | 32.6% 9,257 | 27.3% 7,738 |
| 1988 | 51.1% 12,753 | 46.3% 11,545 | 2.6% 656 |
| 1984 | 63.3% 16,568 | 35.3% 9,229 | 1.4% 362 |
| 1980 | 52.9% 13,804 | 36.8% 9,615 | 10.4% 2,702 |
| 1976 | 42.3% 11,212 | 55.1% 14,620 | 2.6% 680 |
| 1972 | 63.8% 15,714 | 33.2% 8,183 | 3.0% 731 |
| 1968 | 50.3% 11,804 | 42.1% 9,872 | 7.7% 1,798 |
| 1964 | 36.8% 8,829 | 62.3% 14,936 | 0.9% 208 |
| 1960 | 60.2% 14,655 | 39.3% 9,557 | 0.5% 127 |
| 1956 | 66.6% 15,057 | 33.0% 7,461 | 0.5% 102 |
| 1952 | 68.6% 15,762 | 28.5% 6,555 | 2.9% 666 |
| 1948 | 51.9% 11,187 | 46.2% 9,957 | 2.0% 423 |
| 1944 | 58.7% 11,004 | 40.6% 7,604 | 0.7% 135 |
| 1940 | 53.6% 12,448 | 45.4% 10,543 | 0.9% 217 |
| 1936 | 37.6% 8,607 | 62.0% 14,203 | 0.4% 88 |
| 1932 | 47.3% 8,972 | 49.3% 9,351 | 3.4% 647 |
| 1928 | 76.3% 12,872 | 22.8% 3,843 | 0.9% 153 |
| 1924 | 65.2% 10,339 | 23.2% 3,675 | 11.6% 1,837 |
| 1920 | 67.1% 9,649 | 30.5% 4,385 | 2.4% 341 |
| 1916 | 46.1% 6,870 | 44.8% 6,683 | 9.2% 1,366 |
| 1912 | 20.9% 1,668 | 42.1% 3,360 | 37.0% 2,947 |
| 1908 | 52.7% 4,092 | 43.6% 3,381 | 3.7% 289 |
| 1904 | 69.3% 4,245 | 23.2% 1,423 | 7.4% 455 |
| 1900 | 56.0% 3,769 | 42.5% 2,859 | 1.5% 100 |
| 1896 | 52.0% 3,373 | 47.0% 3,051 | 1.0% 67 |
| 1892 | 50.0% 3,166 | 50.0% 3,166[lower-alpha 1] | |
| 1888 | 56.6% 3,398 | 30.7% 1,841 | 12.7% 763 |
Laws
Reno County was a prohibition, or "dry", county until the Kansas Constitution was amended in 1986 and voters approved the sale of alcoholic liquor by the individual drink with a 30 percent food sales requirement. The food sales requirement was removed with voter approval in 2004.[12]
Education
Unified school districts
Communities

Cities
Census-designated place
Other unincorporated communities
- Castleton
- Darlow
- Medora
- Pleasantview
- St. Joe (Ost)
Ghost towns
- Huntsville
- Kent
- Lerado
- Olcott
- Sego
- Yaggy
Townships
Reno County is divided into thirty-one townships. The cities of Hutchinson and Nickerson are considered governmentally independent and are excluded from the census figures for the townships. In the following table, the population center is the largest city (or cities) included in that township's population total, if it is of a significant size.
See also
- National Register of Historic Places listings in Reno County, Kansas
- Reno County Area Transit, known as Rcat, provides public transportation for the citizens of the county.
|
|
References
- 1 2 "State & County QuickFacts". United States Census Bureau. Retrieved July 28, 2014.
- ↑ "Find a County". National Association of Counties. Retrieved 2011-06-07.
- ↑ Rock Island Rail History
- ↑ "US Gazetteer files: 2010, 2000, and 1990". United States Census Bureau. 2011-02-12. Retrieved 2011-04-23.
- ↑ "Population and Housing Unit Estimates". Retrieved June 9, 2017.
- ↑ "U.S. Decennial Census". United States Census Bureau. Retrieved July 28, 2014.
- ↑ "Historical Census Browser". University of Virginia Library. Retrieved July 28, 2014.
- ↑ "Population of Counties by Decennial Census: 1900 to 1990". United States Census Bureau. Retrieved July 28, 2014.
- ↑ "Census 2000 PHC-T-4. Ranking Tables for Counties: 1990 and 2000" (PDF). United States Census Bureau. Retrieved July 28, 2014.
- ↑ "American FactFinder". United States Census Bureau. Retrieved 2008-01-31.
- ↑ http://uselectionatlas.org/RESULTS
- ↑ "Map of Wet and Dry Counties". Alcoholic Beverage Control, Kansas Department of Revenue. November 2006. Archived from the original on 2007-10-08. Retrieved 2007-12-28.
- Notes
- ↑ This total comprises 3,097 votes (48.9%) were for Populist James B. Weaver (who was supported by the state’s Democrats) and 69 (1.1%) for Prohibition Party candidate John Bidwell.
Further reading
- History of Reno County, Kansas : Its People, Industries, and Institutions; 2 Volumes; Sheridan Ploughe; Bowen and Company; 445 / 959 pages; 1917. (Volume1 - Download 19MB PDF eBook), (Volume2 - Download 32MB PDF eBook)
- Standard Atlas of Reno County, Kansas; Geo. A. Ogle & Co; 110 pages; 1918.
- Plat Book of Reno County, Kansas; Hutchinson Blue Print Co; 61 pages; 1912.
- Plat Book of Reno County, Kansas; North West Publishing Co; 77 pages; 1902.
External links
| Wikimedia Commons has media related to Reno County, Kansas. |
| Wikisource has the text of the 1879 American Cyclopædia article Reno. |
- County
- Other
- Maps
- Reno County Maps: Current, Historic, KDOT
- Kansas Highway Maps: Current, Historic, KDOT
- Kansas Railroad Maps: Current, 1996, 1915, KDOT and Kansas Historical Society
Places adjacent to Reno County, Kansas | ||||||||||
|---|---|---|---|---|---|---|---|---|---|---|
| ||||||||||
Municipalities and communities of Reno County, Kansas, United States | ||
|---|---|---|
| Cities | | |
| CDP | ||
| Unincorporated communities | ||
| Ghost towns | ||
| Townships |
| |
