Anderson County, Kansas
| Anderson County, Kansas | |
|---|---|
| County | |
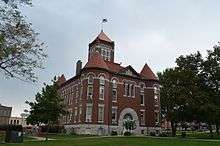 Anderson County Courthouse in Garnett | |
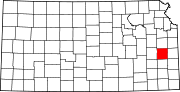 Location in the U.S. state of Kansas | |
 Kansas's location in the U.S. | |
| Coordinates: 38°12′N 95°17′W / 38.200°N 95.283°W | |
| Founded | August 25, 1855 |
| Named for | Joseph C. Anderson |
| Seat | Garnett |
| Largest city | Garnett |
| Area | |
| • Total | 584 sq mi (1,513 km2) |
| • Land | 580 sq mi (1,502 km2) |
| • Water | 7.1 sq mi (18 km2), 0.7% |
| Population (est.) | |
| • (2016) | 7,827 |
| • Density | 14/sq mi (5/km2) |
| Area code(s) | 785 |
| Congressional district | 2nd |
| Time zone | Central: UTC−6/−5 |
| Website | AndersonCountyKS.org |
Anderson County (county code AN) is a county located in East Central Kansas, in the Central United States. As of the 2010 census, the county population was 8,102.[1] Its county seat and most populous city is Garnett.[2]
History
Early history
For many millennia, the Great Plains of North America was inhabited by nomadic Native Americans. From the 16th century to 18th century, the Kingdom of France claimed ownership of large parts of North America. In 1762, after the French and Indian War, France secretly ceded New France to Spain, per the Treaty of Fontainebleau.
19th century
In 1802, Spain returned most of the land to France, but keeping title to about 7,500 square miles. In 1803, most of the land for modern day Kansas was acquired by the United States from France as part of the 828,000 square mile Louisiana Purchase for 2.83 cents per acre.
In 1854, the Kansas Territory was organized, then in 1861 Kansas became the 34th U.S. state. In 1855, Anderson County was established, named for territorial legislator Joseph C. Anderson.
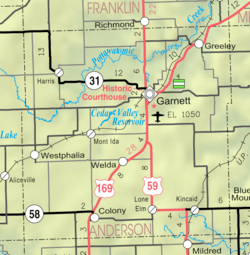
Geography
According to the U.S. Census Bureau, the county has a total area of 584 square miles (1,510 km2), of which 580 square miles (1,500 km2) is land and 4.1 square miles (11 km2) (0.7%) is water.[3]
Adjacent counties
- Franklin County (north)
- Miami County (northeast)
- Linn County (east)
- Bourbon County (southeast)
- Allen County (south)
- Woodson County (southwest)
- Coffey County (west)
Major highways
Demographics
| Historical population | |||
|---|---|---|---|
| Census | Pop. | %± | |
| 1860 | 2,400 | — | |
| 1870 | 5,220 | 117.5% | |
| 1880 | 9,057 | 73.5% | |
| 1890 | 14,203 | 56.8% | |
| 1900 | 13,938 | −1.9% | |
| 1910 | 13,829 | −0.8% | |
| 1920 | 12,986 | −6.1% | |
| 1930 | 13,355 | 2.8% | |
| 1940 | 11,658 | −12.7% | |
| 1950 | 10,267 | −11.9% | |
| 1960 | 9,035 | −12.0% | |
| 1970 | 8,501 | −5.9% | |
| 1980 | 8,749 | 2.9% | |
| 1990 | 7,803 | −10.8% | |
| 2000 | 8,110 | 3.9% | |
| 2010 | 8,102 | −0.1% | |
| Est. 2016 | 7,827 | [6] | −3.4% |
| U.S. Decennial Census[7] 1790-1960[8] 1900-1990[9] 1990-2000[10] 2010-2016[1] | |||

As of the 2000 census,[11] there were 8,110 people, 3,221 households, and 2,264 families residing in the county. The population density was 14 people per square mile (5/km²). There were 3,596 housing units at an average density of 6 per square mile (2/km²). The racial makeup of the county was 97.41% White, 0.32% Black or African American, 0.74% Native American, 0.22% Asian, 0.02% Pacific Islander, 0.33% from other races, and 0.95% from two or more races. Hispanic or Latino of any race were 1.09% of the population. 35.0% were of German, 20.4% American, 10.4% English and 9.9% Irish ancestry.
There were 3,221 households out of which 31.00% had children under the age of 18 living with them, 59.90% were married couples living together, 6.90% had a female householder with no husband present, and 29.70% were non-families. 26.80% of all households were made up of individuals and 15.60% had someone living alone who was 65 years of age or older. The average household size was 2.48 and the average family size was 3.00.
In the county, the population was spread out with 26.20% under the age of 18, 7.00% from 18 to 24, 24.60% from 25 to 44, 22.10% from 45 to 64, and 20.00% who were 65 years of age or older. The median age was 40 years. For every 100 females there were 96.70 males. For every 100 females age 18 and over, there were 93.50 males.
The median income for a household in the county was $33,244, and the median income for a family was $39,101. Males had a median income of $30,102 versus $20,705 for females. The per capita income for the county was $16,458. About 10.60% of families and 12.80% of the population were below the poverty line, including 16.30% of those under age 18 and 11.00% of those age 65 or over.
Government
Presidential elections
| Year | Republican | Democratic | Third Parties |
|---|---|---|---|
| 2016 | 72.7% 2,435 | 20.1% 672 | 7.3% 243 |
| 2012 | 68.7% 2,276 | 28.5% 944 | 2.9% 95 |
| 2008 | 65.1% 2,362 | 32.4% 1,175 | 2.5% 89 |
| 2004 | 64.7% 2,500 | 33.5% 1,295 | 1.8% 68 |
| 2000 | 57.0% 1,984 | 38.2% 1,327 | 4.8% 167 |
| 1996 | 46.7% 1,636 | 39.0% 1,367 | 14.4% 503 |
| 1992 | 33.0% 1,218 | 32.0% 1,178 | 35.0% 1,291 |
| 1988 | 54.3% 1,781 | 44.7% 1,466 | 1.1% 36 |
| 1984 | 67.1% 2,462 | 31.5% 1,155 | 1.4% 50 |
| 1980 | 62.6% 2,363 | 31.0% 1,170 | 6.4% 240 |
| 1976 | 48.7% 1,872 | 49.1% 1,886 | 2.2% 86 |
| 1972 | 70.9% 2,718 | 27.0% 1,035 | 2.2% 83 |
| 1968 | 56.8% 2,168 | 32.6% 1,242 | 10.6% 404 |
| 1964 | 44.8% 1,692 | 54.4% 2,058 | 0.8% 30 |
| 1960 | 62.4% 2,665 | 37.2% 1,589 | 0.5% 20 |
| 1956 | 69.0% 3,080 | 30.7% 1,369 | 0.3% 14 |
| 1952 | 73.2% 3,672 | 26.6% 1,333 | 0.3% 13 |
| 1948 | 56.9% 2,787 | 42.3% 2,071 | 0.9% 44 |
| 1944 | 64.9% 3,060 | 35.0% 1,649 | 0.2% 7 |
| 1940 | 64.4% 3,886 | 35.0% 2,114 | 0.6% 33 |
| 1936 | 54.6% 3,452 | 43.8% 2,767 | 1.6% 99 |
| 1932 | 39.6% 2,408 | 58.9% 3,580 | 1.5% 88 |
| 1928 | 64.9% 3,562 | 34.2% 1,874 | 0.9% 49 |
| 1924 | 61.0% 3,101 | 27.9% 1,421 | 11.1% 563 |
| 1920 | 62.8% 3,068 | 35.0% 1,708 | 2.2% 108 |
| 1916 | 44.0% 2,386 | 50.5% 2,739 | 5.6% 304 |
| 1912 | 19.9% 618 | 43.9% 1,365 | 36.2% 1,125 |
| 1908 | 51.3% 1,722 | 45.0% 1,512 | 3.8% 126 |
| 1904 | 58.3% 1,891 | 32.1% 1,043 | 9.6% 312 |
| 1900 | 50.4% 1,846 | 48.0% 1,757 | 1.6% 60 |
| 1896 | 47.6% 1,780 | 50.5% 1,890 | 1.9% 72 |
| 1892 | 51.1% 1,638 | 48.9% 1,570 | |
| 1888 | 55.1% 1,843 | 28.7% 960 | 16.2% 540 |
Laws
Following amendment to the Kansas Constitution in 1986, the county remained a prohibition, or "dry", county until 1996, when voters approved the sale of alcoholic liquor by the individual drink with a 30 percent food sales requirement.[13]
Education
Unified school districts
Communities
Cities
Census-designated places
Other unincorporated communities
Townships
Anderson County is divided into fourteen townships. The city of Garnett is considered governmentally independent and is excluded from the census figures for the townships. In the following table, the population center is the largest city (or cities) included in that township's population total, if it is of a significant size.
See also

|
|
References
- 1 2 "State & County QuickFacts". United States Census Bureau. Retrieved July 21, 2014.
- ↑ "Find a County". National Association of Counties. Archived from the original on 2011-05-31. Retrieved 2011-06-07.
- ↑ "US Gazetteer files: 2010, 2000, and 1990". United States Census Bureau. 2011-02-12. Retrieved 2011-04-23.
- ↑ National Atlas Archived December 5, 2008, at the Wayback Machine.
- ↑ U.S. Census Bureau TIGER shape files
- ↑ "Population and Housing Unit Estimates". Retrieved June 9, 2017.
- ↑ "U.S. Decennial Census". United States Census Bureau. Archived from the original on May 12, 2015. Retrieved July 21, 2014.
- ↑ "Historical Census Browser". University of Virginia Library. Retrieved July 21, 2014.
- ↑ "Population of Counties by Decennial Census: 1900 to 1990". United States Census Bureau. Retrieved July 21, 2014.
- ↑ "Census 2000 PHC-T-4. Ranking Tables for Counties: 1990 and 2000" (PDF). United States Census Bureau. Retrieved July 21, 2014.
- ↑ "American FactFinder". United States Census Bureau. Archived from the original on 2013-09-11. Retrieved 2008-01-31.
- ↑ http://uselectionatlas.org/RESULTS
- ↑ "Map of Wet and Dry Counties". Alcoholic Beverage Control, Kansas Department of Revenue. November 2004. Archived from the original on 2007-10-08. Retrieved 2007-01-21.
Further reading
- Plat Book of Anderson County, Kansas; Northwest Publishing Company; 41 pages; 1901.
External links
| Wikimedia Commons has media related to Anderson County, Kansas. |
- County
- Anderson County - Official
- Anderson County - Directory of Public Officials
- Anderson County - Development Agency
- Historical
- Anderson County - History, Kansas State Historical Society
- Poster from Ninth Annual Anderson County Fair from September 25-28, 1891
- Maps
- Anderson County Maps: Current, Historic, KDOT
- Kansas Highway Maps: Current, Historic, KDOT
- Kansas Railroad Maps: Current, 1996, 1915, KDOT and Kansas Historical Society
Places adjacent to Anderson County, Kansas | ||||||||||
|---|---|---|---|---|---|---|---|---|---|---|
| ||||||||||
Municipalities and communities of Anderson County, Kansas, United States | ||
|---|---|---|
| Cities | | |
| CDPs | ||
| Unincorporated communities | ||
| Ghost town | ||
| Townships | ||
