Nemaha County, Kansas
| Nemaha County, Kansas | |
|---|---|
| County | |
 | |
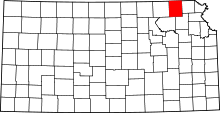 Location in the U.S. state of Kansas | |
 Kansas's location in the U.S. | |
| Founded | August 25, 1855 |
| Named for | Nemaha River |
| Seat | Seneca |
| Largest city | Sabetha |
| Area | |
| • Total | 719 sq mi (1,862 km2) |
| • Land | 717 sq mi (1,857 km2) |
| • Water | 2.0 sq mi (5 km2), 0.3% |
| Population (est.) | |
| • (2016) | 10,241 |
| • Density | 14/sq mi (5/km2) |
| Congressional district | 2nd |
| Time zone | Central: UTC−6/−5 |
| Website | ks-nemaha.manatron.com |
Nemaha County (standard abbreviation: NM) is a county located in the northeastern part of the U.S. state of Kansas. As of the 2010 census, the county population was 10,178.[1] The county seat is Seneca.[2]
History
Early history
For many millennia, the Great Plains of North America was inhabited by nomadic Native Americans. From the 16th century to 18th century, the Kingdom of France claimed ownership of large parts of North America. In 1762, after the French and Indian War, France secretly ceded New France to Spain, per the Treaty of Fontainebleau.
19th century
In 1802, Spain returned most of the land to France, but keeping title to about 7,500 square miles. In 1803, most of the land for modern day Kansas was acquired by the United States from France as part of the 828,000 square mile Louisiana Purchase for 2.83 cents per acre.
In 1854, the Kansas Territory was organized, then in 1861 Kansas became the 34th U.S. state. In 1855, Nemaha County was established.
The first railroad in Nemaha County was built in 1866.[3]
On May 30, 1879, the "Irving, Kansas Tornado" passed through Nemaha county. This tornado measured F4 on the Fujita scale, and had a damage path 800 yards (730 m) wide and 100 miles (160 km) long. Eighteen people were killed and sixty were injured in this tornado.
Geography
According to the U.S. Census Bureau, the county has a total area of 719 square miles (1,860 km2), of which 717 square miles (1,860 km2) is land and 2.0 square miles (5.2 km2) (0.3%) is water.[4]
Adjacent counties
- Richardson County, Nebraska (northeast)
- Brown County (east)
- Jackson County (southeast)
- Pottawatomie County (southwest)
- Marshall County (west)
- Pawnee County, Nebraska (northwest)
Demographics
| Historical population | |||
|---|---|---|---|
| Census | Pop. | %± | |
| 1860 | 2,436 | — | |
| 1870 | 7,339 | 201.3% | |
| 1880 | 12,462 | 69.8% | |
| 1890 | 19,249 | 54.5% | |
| 1900 | 20,376 | 5.9% | |
| 1910 | 19,072 | −6.4% | |
| 1920 | 18,487 | −3.1% | |
| 1930 | 18,342 | −0.8% | |
| 1940 | 16,761 | −8.6% | |
| 1950 | 14,341 | −14.4% | |
| 1960 | 12,897 | −10.1% | |
| 1970 | 11,825 | −8.3% | |
| 1980 | 11,211 | −5.2% | |
| 1990 | 10,446 | −6.8% | |
| 2000 | 10,717 | 2.6% | |
| 2010 | 10,178 | −5.0% | |
| Est. 2016 | 10,241 | [5] | 0.6% |
| U.S. Decennial Census[6] 1790-1960[7] 1900-1990[8] 1990-2000[9] 2010-2016[1] | |||
As of the census[10] of 2000, there were 10,717 people, 3,959 households, and 2,763 families residing in the county. The population density was 15 people per square mile (6/km²). There were 4,340 housing units at an average density of 6 per square mile (2/km²). The racial makeup of the county was 98.35% White, 0.49% Black or African American, 0.23% Native American, 0.10% Asian, 0.06% Pacific Islander, 0.17% from other races, and 0.60% from two or more races. 0.71% of the population were Hispanic or Latino of any race.
There were 3,959 households out of which 34.00% had children under the age of 18 living with them, 61.90% were married couples living together, 5.10% had a female householder with no husband present, and 30.20% were non-families. 28.00% of all households were made up of individuals and 16.00% had someone living alone who was 65 years of age or older. The average household size was 2.58 and the average family size was 3.20.
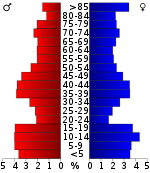
In the county, the population was spread out with 28.50% under the age of 18, 6.00% from 18 to 24, 24.10% from 25 to 44, 19.40% from 45 to 64, and 22.00% who were 65 years of age or older. The median age was 39 years. For every 100 females there were 97.00 males. For every 100 females age 18 and over, there were 95.10 males.
The median income for a household in the county was $34,296, and the median income for a family was $41,838. Males had a median income of $28,879 versus $19,340 for females. The per capita income for the county was $17,121. About 6.50% of families and 9.10% of the population were below the poverty line, including 9.90% of those under age 18 and 8.50% of those age 65 or over.
Government
Presidential elections
| Year | Republican | Democratic | Third Parties |
|---|---|---|---|
| 2016 | 80.5% 4,124 | 14.2% 725 | 5.3% 273 |
| 2012 | 78.2% 3,930 | 19.9% 1,000 | 1.9% 96 |
| 2008 | 71.2% 3,817 | 26.7% 1,432 | 2.1% 110 |
| 2004 | 73.7% 4,027 | 24.8% 1,355 | 1.5% 81 |
| 2000 | 67.6% 3,578 | 28.2% 1,494 | 4.1% 218 |
| 1996 | 56.1% 3,014 | 30.7% 1,648 | 13.3% 713 |
| 1992 | 39.5% 2,220 | 28.1% 1,580 | 32.4% 1,819 |
| 1988 | 55.0% 2,849 | 43.6% 2,261 | 1.4% 72 |
| 1984 | 66.6% 3,653 | 32.1% 1,761 | 1.3% 71 |
| 1980 | 65.0% 3,546 | 29.3% 1,600 | 5.7% 310 |
| 1976 | 50.7% 2,759 | 47.5% 2,586 | 1.8% 96 |
| 1972 | 64.1% 3,422 | 33.3% 1,777 | 2.7% 143 |
| 1968 | 54.0% 3,003 | 34.6% 1,925 | 11.4% 632 |
| 1964 | 42.1% 2,391 | 57.4% 3,260 | 0.6% 32 |
| 1960 | 53.6% 3,360 | 46.0% 2,884 | 0.4% 23 |
| 1956 | 67.1% 4,195 | 32.6% 2,038 | 0.3% 18 |
| 1952 | 76.0% 5,175 | 23.8% 1,618 | 0.3% 19 |
| 1948 | 55.4% 3,529 | 44.1% 2,810 | 0.5% 32 |
| 1944 | 66.4% 4,277 | 33.4% 2,149 | 0.2% 11 |
| 1940 | 65.6% 5,178 | 34.0% 2,679 | 0.4% 32 |
| 1936 | 47.8% 3,903 | 51.1% 4,175 | 1.2% 94 |
| 1932 | 40.6% 3,167 | 58.7% 4,578 | 0.7% 55 |
| 1928 | 61.1% 4,639 | 38.5% 2,919 | 0.5% 34 |
| 1924 | 60.2% 4,096 | 27.2% 1,846 | 12.6% 857 |
| 1920 | 72.3% 4,655 | 26.9% 1,731 | 0.8% 51 |
| 1916 | 49.2% 3,591 | 49.0% 3,579 | 1.8% 130 |
| 1912 | 22.2% 961 | 44.7% 1,936 | 33.1% 1,433 |
| 1908 | 51.6% 2,394 | 47.0% 2,182 | 1.4% 66 |
| 1904 | 61.9% 2,764 | 35.0% 1,564 | 3.0% 135 |
| 1900 | 53.5% 2,761 | 45.5% 2,348 | 1.1% 57 |
| 1896 | 50.5% 2,568 | 48.7% 2,478 | 0.8% 40 |
| 1892 | 49.7% 2,222 | 50.3% 2,246[lower-alpha 1] | |
| 1888 | 56.5% 2,515 | 37.8% 1,682 | 5.6% 251 |
Laws
Nemaha County was a prohibition, or "dry", county until the Kansas Constitution was amended in 1986 and voters approved the sale of alcoholic liquor by the individual drink with a 30% food sales requirement.[12]
Education
Unified school districts
- Prairie Hills USD 113 - Bern, Sabetha, Wetmore, (Axtell and Summerfield in Marshall County). USD 441 and USD 488 merged to create USD 113 in 2010.
- Nemaha Central USD 115 - Baileyville, Seneca, St. Benedict. USD 442 and USD 451 merged to create USD 115 in 2011.[13]
- Vermillion USD 380 - Centralia, (Frankfort in Marshall County)
Communities
Cities
Census-designated place
Other unincorporated communities
Townships
Nemaha County is divided into twenty townships. The cities of Sabetha and Seneca are considered governmentally independent and are excluded from the census figures for the townships. In the following table, the population center is the largest city (or cities) included in that township's population total, if it is of a significant size.
See also
|
|
References
- 1 2 "State & County QuickFacts". United States Census Bureau. Archived from the original on July 15, 2011. Retrieved July 27, 2014.
- ↑ "Find a County". National Association of Counties. Retrieved 2011-06-07.
- ↑ Blackmar, Frank Wilson (1912). Kansas: A Cyclopedia of State History, Volume 2. Standard Publishing Company. p. 345.
- ↑ "US Gazetteer files: 2010, 2000, and 1990". United States Census Bureau. 2011-02-12. Retrieved 2011-04-23.
- ↑ "Population and Housing Unit Estimates". Retrieved June 9, 2017.
- ↑ "U.S. Decennial Census". United States Census Bureau. Retrieved July 27, 2014.
- ↑ "Historical Census Browser". University of Virginia Library. Retrieved July 27, 2014.
- ↑ "Population of Counties by Decennial Census: 1900 to 1990". United States Census Bureau. Retrieved July 27, 2014.
- ↑ "Census 2000 PHC-T-4. Ranking Tables for Counties: 1990 and 2000" (PDF). United States Census Bureau. Retrieved July 27, 2014.
- ↑ "American FactFinder". United States Census Bureau. Retrieved 2008-01-31.
- ↑ http://uselectionatlas.org/RESULTS
- ↑ "Map of Wet and Dry Counties". Alcoholic Beverage Control, Kansas Department of Revenue. November 2006. Archived from the original on 2007-10-08. Retrieved 2007-12-28.
- ↑ Nemaha County School Districts Merge To Form USD 115
- Notes
- ↑ 2,194 votes (49.10 percent) were for Populist James B. Weaver (who was supported by the state’s Democrats) and 52 (1.16 percent) for Prohibition Party candidate John Bidwell.
Further reading
- Atlas of Nemaha County, Kansas; Anderson Publishing Co; 62 pages; 1922.
- Plat Book of Nemaha County, Kansas; A.R. Stinson; 53 pages; 1908.
External links
| Wikimedia Commons has media related to Nemaha County, Kansas. |
- County
- Other information
- Maps
- Nemaha County Maps: Current, Historic, KDOT
- Kansas Highway Maps: Current, Historic, KDOT
- Kansas Railroad Maps: Current, 1996, 1915, KDOT and Kansas Historical Society
Places adjacent to Nemaha County, Kansas | |
|---|---|
Municipalities and communities of Nemaha County, Kansas, United States | ||
|---|---|---|
| Cities | | |
| CDP | ||
| Unincorporated communities | ||
| Footnotes | ‡This populated place also has portions in an adjacent county or counties | |
