Elk County, Kansas
| Elk County, Kansas | |
|---|---|
| County | |
.jpg) | |
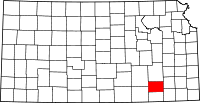 Location in the U.S. state of Kansas | |
 Kansas's location in the U.S. | |
| Coordinates: 37°27′N 96°14′W / 37.450°N 96.233°W | |
| Founded | March 25, 1875 |
| Named for | Elk River |
| Seat | Howard |
| Largest city | Howard |
| Area | |
| • Total | 650 sq mi (1,683 km2) |
| • Land | 644 sq mi (1,668 km2) |
| • Water | 6.2 sq mi (16 km2), 1.0% |
| Population (est.) | |
| • (2016) | 2,547 |
| • Density | 4.5/sq mi (1.7/km2) |
| Area code(s) | 620 |
| Congressional district | 4th |
| Time zone | Central: UTC−6/−5 |
| Website | elkcountyks.org |
Elk County (county code EK) is a county located in the U.S. state of Kansas. As of the 2010 census, the county population was 2,882.[1] Its county seat and most populous city is Howard.[2]
History
Early history
For many millennia, the Great Plains of North America was inhabited by nomadic Native Americans. From the 16th century to 18th century, the Kingdom of France claimed ownership of large parts of North America. In 1762, after the French and Indian War, France secretly ceded New France to Spain, per the Treaty of Fontainebleau.
19th century
In 1802, Spain returned most of the land to France, but keeping title to about 7,500 square miles. In 1803, most of the land for modern day Kansas was acquired by the United States from France as part of the 828,000 square mile Louisiana Purchase for 2.83 cents per acre.
In 1854, the United States organized Kansas Territory, after it had served as an area to relocate Native American tribes from the Southeast. In 1861, Kansas was admitted as the 34th U.S. state. In 1875, Elk County was established, named for the Elk River.[3]
The first railroad in Elk County was built through that territory in 1879.[4] It connected ranches and farms to markets.
Geography
According to the U.S. Census Bureau, the county has a total area of 650 square miles (1,700 km2), of which 644 square miles (1,670 km2) is land and 6.2 square miles (16 km2) (1.0%) is water.[5]
Adjacent counties
- Greenwood County (north)
- Wilson County (east)
- Montgomery County (southeast)
- Chautauqua County (south)
- Cowley County (southwest)
- Butler County (northwest)
Demographics
| Historical population | |||
|---|---|---|---|
| Census | Pop. | %± | |
| 1880 | 10,623 | — | |
| 1890 | 12,216 | 15.0% | |
| 1900 | 11,443 | −6.3% | |
| 1910 | 10,128 | −11.5% | |
| 1920 | 9,034 | −10.8% | |
| 1930 | 9,210 | 1.9% | |
| 1940 | 8,180 | −11.2% | |
| 1950 | 6,679 | −18.3% | |
| 1960 | 5,048 | −24.4% | |
| 1970 | 3,858 | −23.6% | |
| 1980 | 3,918 | 1.6% | |
| 1990 | 3,327 | −15.1% | |
| 2000 | 3,261 | −2.0% | |
| 2010 | 2,882 | −11.6% | |
| Est. 2016 | 2,547 | [6] | −11.6% |
| U.S. Decennial Census[7] 1790-1960[8] 1900-1990[9] 1990-2000[10] 2010-2016[1] | |||

As of the 2000 census,[11] there were 3,261 people, 1,412 households, and 923 families residing in the county. The population density was 5 people per square mile (2/km²). There were 1,860 housing units at an average density of 3 per square mile (1/km²). The racial makeup of the county was 95.06% White, 0.21% Black or African American, 0.95% Native American, 0.18% Asian, 0.06% Pacific Islander, 1.20% from other races, and 2.33% from two or more races. Hispanic or Latino of any race were 2.18% of the population.
There were 1,412 households out of which 24.40% had children under the age of 18 living with them, 56.00% were married couples living together, 6.10% had a female householder with no husband present, and 34.60% were non-families. 32.90% of all households were made up of individuals and 18.60% had someone living alone who was 65 years of age or older. The average household size was 2.25 and the average family size was 2.84.
In the county, the population was spread out with 22.50% under the age of 18, 5.80% from 18 to 24, 20.00% from 25 to 44, 26.50% from 45 to 64, and 25.30% who were 65 years of age or older. The median age was 46 years. For every 100 females there were 91.50 males. For every 100 females age 18 and over, there were 91.70 males.
The median income for a household in the county was $27,267, and the median income for a family was $34,148. Males had a median income of $28,580 versus $16,219 for females. The per capita income for the county was $16,066. About 9.20% of families and 13.80% of the population were below the poverty line, including 18.80% of those under age 18 and 15.00% of those age 65 or over.
Government
Presidential elections
| Year | Republican | Democratic | Third Parties |
|---|---|---|---|
| 2016 | 83.2% 1,048 | 12.7% 160 | 4.1% 51 |
| 2012 | 76.6% 1,049 | 20.5% 281 | 2.9% 39 |
| 2008 | 72.7% 1,042 | 25.3% 363 | 2.0% 29 |
| 2004 | 73.9% 1,119 | 24.4% 369 | 1.8% 27 |
| 2000 | 69.7% 1,080 | 25.9% 402 | 4.4% 68 |
| 1996 | 56.8% 933 | 29.7% 488 | 13.5% 222 |
| 1992 | 42.9% 748 | 27.8% 485 | 29.2% 509 |
| 1988 | 63.0% 1,075 | 35.6% 608 | 1.4% 23 |
| 1984 | 72.9% 1,301 | 25.3% 452 | 1.8% 32 |
| 1980 | 69.7% 1,280 | 26.2% 482 | 4.1% 75 |
| 1976 | 54.8% 1,087 | 43.6% 865 | 1.5% 30 |
| 1972 | 76.0% 1,522 | 21.4% 428 | 2.6% 52 |
| 1968 | 64.6% 1,327 | 24.5% 503 | 10.9% 223 |
| 1964 | 55.7% 1,267 | 43.7% 994 | 0.5% 12 |
| 1960 | 68.5% 1,830 | 30.8% 823 | 0.8% 20 |
| 1956 | 69.9% 1,909 | 29.7% 812 | 0.4% 10 |
| 1952 | 76.4% 2,380 | 23.0% 717 | 0.6% 19 |
| 1948 | 63.8% 1,962 | 35.4% 1,087 | 0.9% 26 |
| 1944 | 70.3% 2,283 | 29.4% 954 | 0.3% 9 |
| 1940 | 64.8% 2,774 | 34.5% 1,478 | 0.7% 31 |
| 1936 | 53.2% 2,355 | 46.6% 2,059 | 0.2% 9 |
| 1932 | 43.0% 1,746 | 55.2% 2,239 | 1.8% 72 |
| 1928 | 77.5% 3,007 | 21.4% 831 | 1.1% 42 |
| 1924 | 64.3% 2,443 | 29.0% 1,104 | 6.7% 255 |
| 1920 | 65.3% 2,253 | 32.2% 1,110 | 2.6% 89 |
| 1916 | 43.9% 1,769 | 51.0% 2,053 | 5.1% 204 |
| 1912 | 24.1% 605 | 38.7% 971 | 37.2% 935 |
| 1908 | 54.1% 1,454 | 44.2% 1,187 | 1.7% 46 |
| 1904 | 67.5% 1,713 | 27.8% 706 | 4.7% 120 |
| 1900 | 55.2% 1,632 | 44.4% 1,311 | 0.4% 13 |
| 1896 | 47.6% 1,339 | 52.0% 1,464 | 0.4% 12 |
| 1892 | 47.2% 1,235 | 52.8% 1,382 | |
| 1888 | 53.7% 1,566 | 23.9% 696 | 22.4% 654 |
Laws
The Kansas Constitution was amended in 1986 to allow the sale of alcoholic liquor by the individual drink, with approval by voters. Elk County voters have chosen to remain a prohibition, or "dry", county.[13]
Education
Unified school districts
Communities
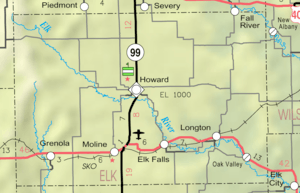
Cities
Unincorporated communities
Townships
Elk County is divided into ten townships. None of the cities within the county is designated as governmentally independent. All population figures for the townships include those of the cities. In the following table, the population center is the largest city (or cities) included in that township's population total, if it is of a significant size.
| Township | FIPS | Population center |
Population | Population density /km² (/sq mi) |
Land area km² (sq mi) | Water area km² (sq mi) | Water % | Geographic coordinates |
|---|---|---|---|---|---|---|---|---|
| Elk Falls | 20325 | 196 | 1 (3) | 152 (59) | 0 (0) | 0.19% | 37°22′17″N 96°12′26″W / 37.37139°N 96.20722°W | |
| Greenfield | 28550 | 321 | 2 (5) | 171 (66) | 1 (0) | 0.62% | 37°21′8″N 96°27′5″W / 37.35222°N 96.45139°W | |
| Howard | 33275 | Howard | 1,006 | 6 (16) | 166 (64) | 1 (1) | 0.86% | 37°28′3″N 96°15′14″W / 37.46750°N 96.25389°W |
| Liberty | 40025 | 117 | 1 (2) | 154 (59) | 0 (0) | 0.19% | 37°34′22″N 96°1′55″W / 37.57278°N 96.03194°W | |
| Longton | 42675 | 530 | 5 (12) | 116 (45) | 0 (0) | 0.11% | 37°22′38″N 96°5′27″W / 37.37722°N 96.09083°W | |
| Oak Valley | 51950 | 154 | 1 (3) | 116 (45) | 0 (0) | 0.24% | 37°21′59″N 96°1′14″W / 37.36639°N 96.02056°W | |
| Painterhood | 54075 | 68 | 0 (1) | 154 (59) | 1 (0) | 0.37% | 37°27′35″N 96°2′37″W / 37.45972°N 96.04361°W | |
| Paw Paw | 54925 | 116 | 1 (2) | 141 (54) | 0 (0) | 0.24% | 37°33′19″N 96°13′46″W / 37.55528°N 96.22944°W | |
| Union Center | 72500 | 116 | 0 (1) | 371 (143) | 2 (1) | 0.46% | 37°31′44″N 96°23′31″W / 37.52889°N 96.39194°W | |
| Wildcat | 79150 | 637 | 5 (12) | 135 (52) | 2 (1) | 1.35% | 37°21′33″N 96°19′10″W / 37.35917°N 96.31944°W | |
| Sources: "Census 2000 U.S. Gazetteer Files". U.S. Census Bureau, Geography Division. Archived from the original on 2002-08-02. | ||||||||
See also
|
|
References
- 1 2 "State & County QuickFacts". United States Census Bureau. Archived from the original on July 9, 2011. Retrieved July 24, 2014.
- ↑ "Find a County". National Association of Counties. Archived from the original on 2011-05-31. Retrieved 2011-06-07.
- ↑ "Elk County, Kansas". Kansas Historical Society. Retrieved 20 March 2014.
- ↑ Blackmar, Frank Wilson (1912). Kansas: A Cyclopedia of State History, Embracing Events, Institutions, Industries, Counties, Cities, Towns, Prominent Persons, Etc. Standard Publishing Company. pp. 573–574.
- ↑ "US Gazetteer files: 2010, 2000, and 1990". United States Census Bureau. 2011-02-12. Retrieved 2011-04-23.
- ↑ "Population and Housing Unit Estimates". Retrieved June 9, 2017.
- ↑ "U.S. Decennial Census". United States Census Bureau. Archived from the original on May 12, 2015. Retrieved July 24, 2014.
- ↑ "Historical Census Browser". University of Virginia Library. Retrieved July 24, 2014.
- ↑ "Population of Counties by Decennial Census: 1900 to 1990". United States Census Bureau. Retrieved July 24, 2014.
- ↑ "Census 2000 PHC-T-4. Ranking Tables for Counties: 1990 and 2000" (PDF). United States Census Bureau. Retrieved July 24, 2014.
- ↑ "American FactFinder". United States Census Bureau. Archived from the original on 2013-09-11. Retrieved 2008-01-31.
- ↑ http://uselectionatlas.org/RESULTS
- ↑ "Map of Wet and Dry Counties". Alcoholic Beverage Control, Kansas Department of Revenue. November 2004. Archived from the original on 2007-10-08. Retrieved 2007-01-21.
Further reading
- Elk County, Kansas; H. F. Smith; 1927.
- Elk County Rural Landowners Plat Map; 1927.
- Standard Atlas of Elk County, Kansas; George A. Ogle & Co; 43 pages; 1903.
- Atlas of Elk County; Davy Map & Atlas Co; 45 pages; 1885.
External links
| Wikimedia Commons has media related to Elk County, Kansas. |
- County
- Maps
- Elk County Maps: Current, Historic, KDOT
- Kansas Highway Maps: Current, Historic, KDOT
- Kansas Railroad Maps: Current, 1996, 1915, KDOT and Kansas Historical Society
Places adjacent to Elk County, Kansas | ||||||||||
|---|---|---|---|---|---|---|---|---|---|---|
| ||||||||||
Municipalities and communities of Elk County, Kansas, United States | ||
|---|---|---|
| Cities | | |
| Unincorporated communities | ||
| Townships | ||
