Franklin County, Kansas
| Franklin County, Kansas | |
|---|---|
| County | |
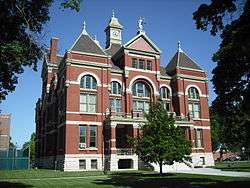 Franklin County Courthouse in Ottawa | |
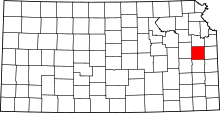 Location in the U.S. state of Kansas | |
 Kansas's location in the U.S. | |
| Founded | August 25, 1855 |
| Named for | Benjamin Franklin |
| Seat | Ottawa |
| Largest city | Ottawa |
| Area | |
| • Total | 577 sq mi (1,494 km2) |
| • Land | 572 sq mi (1,481 km2) |
| • Water | 5.4 sq mi (14 km2), 0.9% |
| Population (est.) | |
| • (2016) | 25,560 |
| • Density | 45/sq mi (17/km2) |
| Congressional district | 2nd |
| Time zone | Central: UTC−6/−5 |
| Website | FranklinCoKS.org |
Franklin County (county code FR) is a county located in the eastern portion of the U.S. state of Kansas. As of the 2010 census, the county population was 25,992.[1] Its county seat and most populous city is Ottawa.[2]
History
Early history
For many millennia, the Great Plains of North America was inhabited by nomadic Native Americans. From the 16th century to 18th century, the Kingdom of France claimed ownership of large parts of North America. In 1762, after the French and Indian War, France secretly ceded New France to Spain, per the Treaty of Fontainebleau.
19th century
In 1802, Spain returned most of the land to France, but keeping title to about 7,500 square miles. In 1803, most of the land for modern day Kansas was acquired by the United States from France as part of the 828,000 square mile Louisiana Purchase for 2.83 cents per acre.
The area was included in a treaty ceding land to the Osage Nation in 1808, and ceded back to the federal government in 1825. After 1825 and prior to 1867, treaties with various Indian nations set off parts of what was later to become Franklin County for their use.
In 1854, the Kansas Territory was organized, then in 1861 Kansas became the 34th U.S. state. In 1855, Franklin County was established. Franklin County was one of the 33 original Kansas Territory counties created by the first Territorial Legislature of 1855.[3] The county was named after Benjamin Franklin.[4]
Geography
According to the U.S. Census Bureau, the county has a total area of 577 square miles (1,490 km2), of which 572 square miles (1,480 km2) is land and 5.4 square miles (14 km2) (0.9%) is water.[5]
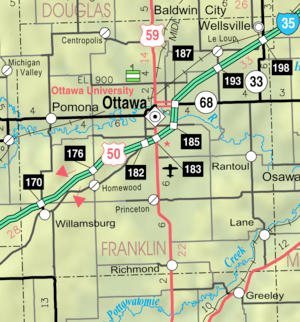
Major highways
Adjacent counties
- Douglas County (north)
- Johnson County (northeast)
- Miami County (east)
- Linn County (southeast)
- Anderson County (south)
- Coffey County (southwest)
- Osage County (west)
Demographics
| Historical population | |||
|---|---|---|---|
| Census | Pop. | %± | |
| 1860 | 3,030 | — | |
| 1870 | 10,385 | 242.7% | |
| 1880 | 16,797 | 61.7% | |
| 1890 | 20,279 | 20.7% | |
| 1900 | 21,354 | 5.3% | |
| 1910 | 20,884 | −2.2% | |
| 1920 | 21,946 | 5.1% | |
| 1930 | 22,024 | 0.4% | |
| 1940 | 20,889 | −5.2% | |
| 1950 | 19,928 | −4.6% | |
| 1960 | 19,548 | −1.9% | |
| 1970 | 20,007 | 2.3% | |
| 1980 | 22,062 | 10.3% | |
| 1990 | 21,994 | −0.3% | |
| 2000 | 24,784 | 12.7% | |
| 2010 | 25,992 | 4.9% | |
| Est. 2016 | 25,560 | [6] | −1.7% |
| U.S. Decennial Census[7] 1790-1960[8] 1900-1990[9] 1990-2000[10] 2010-2016[1] | |||

Franklin County comprises the Ottawa, KS Micropolitan Statistical Area, which is included in the Kansas City-Overland Park-Kansas City, MO-KS Combined Statistical Area.
As of the U.S. Census in 2000,[11] there were 24,784 people, 9,452 households, and 6,720 families residing in the county. The population density was 43 people per square mile (17/km²). There were 10,229 housing units at an average density of 18 per square mile (7/km²). The racial makeup of the county was 95.05% White, 1.21% Black or African American, 0.94% Native American, 0.31% Asian, 0.78% from other races, and 1.71% from two or more races. Hispanic or Latino of any race were 2.62% of the population.
There were 9,452 households out of which 34.70% had children under the age of 18 living with them, 58.10% were married couples living together, 8.90% had a female householder with no husband present, and 28.90% were non-families. 24.80% of all households were made up of individuals and 11.30% had someone living alone who was 65 years of age or older. The average household size was 2.56 and the average family size was 3.04.
In the county, the population was spread out with 27.50% under the age of 18, 8.90% from 18 to 24, 28.30% from 25 to 44, 21.20% from 45 to 64, and 14.00% who were 65 years of age or older. The median age was 36 years. For every 100 females there were 98.30 males. For every 100 females age 18 and over, there were 94.10 males.
The median income for a household in the county was $39,052, and the median income for a family was $45,197. Males had a median income of $31,223 versus $22,992 for females. The per capita income for the county was $17,311. About 5.60% of families and 7.70% of the population were below the poverty line, including 8.40% of those under age 18 and 7.30% of those age 65 or over.
Government
Presidential elections
| Year | Republican | Democratic | Third Parties |
|---|---|---|---|
| 2016 | 65.5% 7,185 | 26.4% 2,892 | 8.1% 888 |
| 2012 | 63.6% 6,984 | 33.6% 3,694 | 2.8% 312 |
| 2008 | 60.0% 7,079 | 37.6% 4,433 | 2.4% 279 |
| 2004 | 64.4% 7,391 | 34.2% 3,921 | 1.4% 164 |
| 2000 | 61.4% 5,925 | 34.4% 3,321 | 4.3% 412 |
| 1996 | 50.9% 5,007 | 36.1% 3,552 | 13.0% 1,276 |
| 1992 | 37.4% 3,699 | 30.0% 2,968 | 32.5% 3,216 |
| 1988 | 56.4% 4,777 | 42.4% 3,592 | 1.1% 96 |
| 1984 | 70.6% 6,284 | 28.4% 2,523 | 1.0% 92 |
| 1980 | 62.7% 5,525 | 31.0% 2,726 | 6.3% 557 |
| 1976 | 55.5% 4,760 | 42.1% 3,607 | 2.5% 211 |
| 1972 | 72.7% 6,011 | 24.9% 2,056 | 2.4% 200 |
| 1968 | 59.2% 4,875 | 30.6% 2,524 | 10.2% 840 |
| 1964 | 45.3% 3,725 | 53.6% 4,410 | 1.1% 86 |
| 1960 | 68.2% 6,158 | 31.3% 2,824 | 0.5% 47 |
| 1956 | 71.4% 6,557 | 28.2% 2,591 | 0.4% 33 |
| 1952 | 72.9% 6,983 | 26.4% 2,532 | 0.7% 69 |
| 1948 | 58.2% 5,145 | 39.3% 3,467 | 2.5% 222 |
| 1944 | 64.7% 5,375 | 34.7% 2,880 | 0.7% 55 |
| 1940 | 63.8% 6,393 | 35.4% 3,542 | 0.9% 85 |
| 1936 | 57.0% 6,007 | 42.7% 4,503 | 0.3% 28 |
| 1932 | 50.2% 4,887 | 48.1% 4,690 | 1.7% 165 |
| 1928 | 78.4% 7,346 | 20.8% 1,951 | 0.8% 73 |
| 1924 | 67.1% 6,008 | 25.9% 2,324 | 7.0% 628 |
| 1920 | 65.2% 5,216 | 32.6% 2,606 | 2.3% 183 |
| 1916 | 45.2% 3,885 | 48.0% 4,128 | 6.8% 588 |
| 1912 | 13.8% 672 | 40.3% 1,970 | 46.0% 2,247[lower-alpha 1] |
| 1908 | 52.7% 2,658 | 42.8% 2,155 | 4.5% 227 |
| 1904 | 62.8% 2,855 | 28.8% 1,310 | 8.3% 378 |
| 1900 | 51.6% 2,872 | 46.8% 2,605 | 1.7% 94 |
| 1896 | 44.9% 2,609 | 54.3% 3,152 | 0.8% 49 |
| 1892 | 46.1% 2,209 | 53.9% 2,587 | |
| 1888 | 50.5% 2,422 | 23.2% 1,113 | 26.3% 1,264 |
Laws
Following amendment to the Kansas Constitution in 1986, the county remained a prohibition, or "dry", county until 1994, when voters approved the sale of alcoholic liquor by the individual drink with a 30 percent food sales requirement.[13]
Education
Unified school districts
Colleges and universities
- Ottawa University, Ottawa
- Neosho County Community College (branch campus), Ottawa
Communities
Cities
Unincorporated places
Ghost town
Townships
Franklin County is divided into sixteen townships. The city of Ottawa is considered governmentally independent and is excluded from the census figures for the townships. In the following table, the population center is the largest city (or cities) included in that township's population total, if it is of a significant size.
| Township | FIPS | Population center |
Population | Population density /km² (/sq mi) |
Land area km² (sq mi) | Water area km² (sq mi) | Water % | Geographic coordinates |
|---|---|---|---|---|---|---|---|---|
| Appanoose | 02075 | 293 | 4 (10) | 77 (30) | 0 (0) | 0.10% | 38°41′57″N 95°27′17″W / 38.69917°N 95.45472°W | |
| Centropolis | 12475 | 997 | 9 (25) | 105 (41) | 0 (0) | 0.34% | 38°41′7″N 95°21′29″W / 38.68528°N 95.35806°W | |
| Cutler | 16900 | Rantoul | 856 | 8 (20) | 111 (43) | 1 (0) | 0.68% | 38°31′33″N 95°6′56″W / 38.52583°N 95.11556°W |
| Franklin | 24375 | Wellsville | 2,552 | 28 (72) | 91 (35) | 0 (0) | 0.52% | 38°42′34″N 95°5′38″W / 38.70944°N 95.09389°W |
| Greenwood | 28750 | 429 | 5 (14) | 79 (30) | 0 (0) | 0.08% | 38°33′39″N 95°26′35″W / 38.56083°N 95.44306°W | |
| Harrison | 30300 | 445 | 6 (16) | 71 (27) | 1 (0) | 0.84% | 38°34′20″N 95°13′2″W / 38.57222°N 95.21722°W | |
| Hayes | 30925 | 397 | 5 (13) | 77 (30) | 0 (0) | 0.36% | 38°42′17″N 95°13′51″W / 38.70472°N 95.23083°W | |
| Homewood | 33000 | 493 | 6 (16) | 78 (30) | 0 (0) | 0.26% | 38°30′53″N 95°23′28″W / 38.51472°N 95.39111°W | |
| Lincoln | 40700 | 797 | 10 (26) | 78 (30) | 0 (0) | 0.31% | 38°34′8″N 95°18′33″W / 38.56889°N 95.30917°W | |
| Ohio | 52350 | Princeton | 783 | 7 (19) | 108 (42) | 1 (0) | 1.05% | 38°29′14″N 95°16′32″W / 38.48722°N 95.27556°W |
| Ottawa | 53575 | 868 | 8 (20) | 111 (43) | 0 (0) | 0.33% | 38°38′21″N 95°16′5″W / 38.63917°N 95.26806°W | |
| Peoria | 55425 | 626 | 7 (18) | 92 (36) | 0 (0) | 0.20% | 38°36′32″N 95°7′45″W / 38.60889°N 95.12917°W | |
| Pomona | 57025 | Pomona | 1,174 | 22 (56) | 54 (21) | 0 (0) | 0.30% | 38°36′40″N 95°27′24″W / 38.61111°N 95.45667°W |
| Pottawatomie | 57225 | Lane | 669 | 7 (17) | 101 (39) | 0 (0) | 0.46% | 38°26′14″N 95°6′32″W / 38.43722°N 95.10889°W |
| Richmond | 59700 | Richmond | 812 | 9 (23) | 91 (35) | 0 (0) | 0.50% | 38°24′19″N 95°15′22″W / 38.40528°N 95.25611°W |
| Williamsburg | 79325 | Williamsburg | 672 | 5 (12) | 145 (56) | 1 (1) | 0.95% | 38°27′33″N 95°27′43″W / 38.45917°N 95.46194°W |
| Sources: "Census 2000 U.S. Gazetteer Files". U.S. Census Bureau, Geography Division. Archived from the original on 2002-08-02. | ||||||||
Notable people
- Steve Grogan, NFL quarterback, who grew up in Ottawa.
- Chely Wright, Singer
- James Still (playwright), Writer, who grew up in Pomona
See also
|
|
References
- 1 2 "State & County QuickFacts". United States Census Bureau. Archived from the original on July 10, 2011. Retrieved July 24, 2014.
- ↑ "Find a County". National Association of Counties. Archived from the original on 2011-05-31. Retrieved 2011-06-07.
- ↑ Blackmar, Frank Wilson (1912). Kansas: A Cyclopedia of State History, Embracing Events, Institutions, Industries, Counties, Cities, Towns, Prominent Persons, Etc. Standard Publishing Company. p. 680.
- ↑ Gannett, Henry (1905). The Origin of Certain Place Names in the United States. Govt. Print. Off. p. 131.
- ↑ "US Gazetteer files: 2010, 2000, and 1990". United States Census Bureau. 2011-02-12. Retrieved 2011-04-23.
- ↑ "Population and Housing Unit Estimates". Retrieved June 9, 2017.
- ↑ "U.S. Decennial Census". United States Census Bureau. Archived from the original on May 12, 2015. Retrieved July 24, 2014.
- ↑ "Historical Census Browser". University of Virginia Library. Retrieved July 24, 2014.
- ↑ "Population of Counties by Decennial Census: 1900 to 1990". United States Census Bureau. Retrieved July 24, 2014.
- ↑ "Census 2000 PHC-T-4. Ranking Tables for Counties: 1990 and 2000" (PDF). United States Census Bureau. Retrieved July 24, 2014.
- ↑ "American FactFinder". United States Census Bureau. Archived from the original on 2013-09-11. Retrieved 2008-01-31.
- ↑ Leip, David. "Dave Leip's Atlas of U.S. Presidential Elections". uselectionatlas.org.
- ↑ "Map of Wet and Dry Counties". Alcoholic Beverage Control, Kansas Department of Revenue. November 2006. Archived from the original on 2007-10-08. Retrieved 2007-12-26.
- Notes
- ↑ This total comprises 1,971 votes (40.31 percent) for Progressive Theodore Roosevelt (who carried the county) and 276 votes (5.65 percent) for Socialist Eugene V. Debs.
Further reading
- Standard Atlas of Franklin County, Kansas; Geo. A. Ogle & Co; 69 pages; 1920.
- Plat Book of Franklin County, Kansas; North West Publishing Co; 36 pages; 1903.
External links
| Wikimedia Commons has media related to Franklin County, Kansas. |
- County
- Historical
- Maps
- Franklin County Maps: Current, Historic, KDOT
- Kansas Highway Maps: Current, Historic, KDOT
- Kansas Railroad Maps: Current, 1996, 1915, KDOT and Kansas Historical Society
Places adjacent to Franklin County, Kansas | ||||||||||
|---|---|---|---|---|---|---|---|---|---|---|
| ||||||||||
Municipalities and communities of Franklin County, Kansas, United States | ||
|---|---|---|
| Cities | | |
| Unincorporated communities | ||
| Ghost towns | ||
| Townships | ||
Kansas City metropolitan area's cities and counties | ||
|---|---|---|
| Central city |  | |
| Largest cities (over 100,000 in 2000) | ||
| Medium-sized cities (10,000 to 100,000 in 2000) | ||
| Smaller Cities (between 5,000 and 9,900 in 2010) | ||
| Counties | ||
