Linn County, Kansas
| Linn County, Kansas | |
|---|---|
| County | |
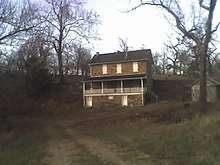 House built by Charles C. Hadsall at Marais des Cygnes Massacre Site[1] | |
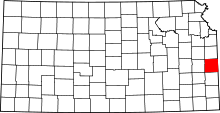 Location in the U.S. state of Kansas | |
 Kansas's location in the U.S. | |
| Founded | February 26, 1867 |
| Named for | Lewis F. Linn |
| Seat | Mound City |
| Largest city | Pleasanton |
| Area | |
| • Total | 606 sq mi (1,570 km2) |
| • Land | 594 sq mi (1,538 km2) |
| • Water | 12 sq mi (31 km2), 2.0% |
| Population (est.) | |
| • (2016) | 9,558 |
| • Density | 16/sq mi (6/km2) |
| Congressional district | 2nd |
| Time zone | Central: UTC−6/−5 |
| Website | LinnCountyKS.com |
Linn County (county code LN) is a county located in east-central Kansas. As of the 2010 census, the county population was 9,656.[2] Its county seat is Mound City,[3] and its most populous city is Pleasanton. The county was named for Lewis F. Linn, a U.S. Senator from Missouri.[4][5]
History
Early history
For many millennia, the Great Plains of North America was inhabited by nomadic Native Americans. From the 16th century to 18th century, the Kingdom of France claimed ownership of large parts of North America. In 1762, after the French and Indian War, France secretly ceded New France to Spain, per the Treaty of Fontainebleau.
19th century
In 1802, Spain returned most of the land to France, but keeping title to about 7,500 square miles. In 1803, most of the land for modern day Kansas was acquired by the United States from France as part of the 828,000 square mile Louisiana Purchase for 2.83 cents per acre.
In 1854, the Kansas Territory was organized, then in 1861 Kansas became the 34th U.S. state. In 1867, Linn County was established.
Geography
According to the U.S. Census Bureau, the county has a total area of 606 square miles (1,570 km2), of which 594 square miles (1,540 km2) is land and 12 square miles (31 km2) (2.0%) is water.[6]
Adjacent counties
- Miami County (north)
- Bates County, Missouri (east)
- Vernon County, Missouri (southeast)
- Bourbon County (south)
- Allen County (southwest)
- Anderson County (west)
- Franklin County (northwest)
National protected area
Demographics
| Historical population | |||
|---|---|---|---|
| Census | Pop. | %± | |
| 1860 | 6,336 | — | |
| 1870 | 12,174 | 92.1% | |
| 1880 | 15,298 | 25.7% | |
| 1890 | 17,215 | 12.5% | |
| 1900 | 16,689 | −3.1% | |
| 1910 | 14,735 | −11.7% | |
| 1920 | 13,815 | −6.2% | |
| 1930 | 13,534 | −2.0% | |
| 1940 | 11,969 | −11.6% | |
| 1950 | 10,053 | −16.0% | |
| 1960 | 8,274 | −17.7% | |
| 1970 | 7,770 | −6.1% | |
| 1980 | 8,234 | 6.0% | |
| 1990 | 8,254 | 0.2% | |
| 2000 | 9,570 | 15.9% | |
| 2010 | 9,656 | 0.9% | |
| Est. 2016 | 9,558 | [7] | −1.0% |
| U.S. Decennial Census[8] 1790-1960[9] 1900-1990[10] 1990-2000[11] 2010-2016[2] | |||
Linn County is included in the Kansas City, MO-KS Metropolitan Statistical Area.
As of the 2000 census,[12] there were 9,570 people, 3,807 households, and 2,748 families residing in the county. The population density was 16 people per square mile (6/km²). There were 4,720 housing units at an average density of 8 per square mile (3/km²). The racial makeup of the county was 97.50% White, 0.63% Black or African American, 0.48% Native American, 0.14% Asian, 0.04% Pacific Islander, 0.16% from other races, and 1.06% from two or more races. Hispanic or Latino of any race were 0.91% of the population.
There were 3,807 households out of which 28.90% had children under the age of 18 living with them, 62.70% were married couples living together, 6.20% had a female householder with no husband present, and 27.80% were non-families. 24.00% of all households were made up of individuals and 13.00% had someone living alone who was 65 years of age or older. The average household size was 2.48 and the average family size was 2.94.
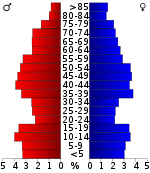
In the county, the population was spread out with 25.00% under the age of 18, 6.70% from 18 to 24, 24.30% from 25 to 44, 25.70% from 45 to 64, and 18.30% who were 65 years of age or older. The median age was 41 years. For every 100 females there were 100.00 males. For every 100 females age 18 and over, there were 97.60 males.
The median income for a household in the county was $35,906, and the median income for a family was $42,571. Males had a median income of $31,720 versus $22,287 for females. The per capita income for the county was $17,009. About 7.80% of families and 11.00% of the population were below the poverty line, including 14.20% of those under age 18 and 9.60% of those age 65 or over.
Government
Presidential elections
| Year | Republican | Democratic | Third Parties |
|---|---|---|---|
| 2016 | 78.2% 3,484 | 16.5% 736 | 5.3% 234 |
| 2012 | 71.1% 3,177 | 26.2% 1,170 | 2.7% 120 |
| 2008 | 66.8% 3,086 | 30.9% 1,425 | 2.3% 106 |
| 2004 | 64.3% 3,048 | 34.4% 1,631 | 1.3% 62 |
| 2000 | 59.0% 2,513 | 37.3% 1,587 | 3.7% 159 |
| 1996 | 49.0% 2,077 | 37.5% 1,590 | 13.4% 568 |
| 1992 | 34.2% 1,413 | 32.8% 1,353 | 33.0% 1,365 |
| 1988 | 58.6% 2,163 | 40.6% 1,497 | 0.8% 31 |
| 1984 | 70.3% 2,795 | 29.0% 1,152 | 0.7% 27 |
| 1980 | 64.9% 2,407 | 31.2% 1,157 | 3.9% 146 |
| 1976 | 52.0% 1,873 | 46.7% 1,681 | 1.3% 48 |
| 1972 | 73.4% 2,593 | 24.8% 876 | 1.8% 63 |
| 1968 | 63.1% 2,250 | 25.1% 893 | 11.8% 422 |
| 1964 | 52.7% 1,939 | 46.9% 1,725 | 0.4% 15 |
| 1960 | 70.2% 2,824 | 29.2% 1,176 | 0.6% 24 |
| 1956 | 71.6% 2,991 | 28.2% 1,177 | 0.2% 7 |
| 1952 | 74.0% 3,527 | 25.6% 1,220 | 0.4% 20 |
| 1948 | 60.5% 2,632 | 38.4% 1,673 | 1.1% 49 |
| 1944 | 68.5% 3,185 | 31.0% 1,442 | 0.4% 20 |
| 1940 | 66.0% 4,086 | 33.4% 2,067 | 0.6% 34 |
| 1936 | 58.8% 3,872 | 40.7% 2,682 | 0.5% 33 |
| 1932 | 44.5% 2,647 | 54.0% 3,216 | 1.5% 90 |
| 1928 | 75.2% 4,231 | 23.6% 1,328 | 1.2% 68 |
| 1924 | 57.9% 3,161 | 30.8% 1,683 | 11.3% 614 |
| 1920 | 62.8% 3,189 | 34.8% 1,764 | 2.4% 122 |
| 1916 | 45.5% 2,699 | 49.4% 2,930 | 5.2% 307 |
| 1912 | 24.0% 858 | 35.8% 1,283 | 40.2% 1,441[lower-alpha 1] |
| 1908 | 51.8% 1,950 | 44.0% 1,657 | 4.2% 158 |
| 1904 | 62.5% 2,324 | 29.2% 1,085 | 8.3% 307 |
| 1900 | 52.2% 2,279 | 46.8% 2,043 | 0.9% 41 |
| 1896 | 46.6% 2,153 | 52.5% 2,424 | 0.8% 39 |
| 1892 | 49.4% 2,046 | 50.6% 2,098[lower-alpha 2] | |
| 1888 | 52.5% 2,166 | 19.4% 802 | 28.1% 1,157 |
Laws
Following amendment to the Kansas Constitution in 1986, the county remained a prohibition, or "dry", county until 2004, when voters approved the sale of alcoholic liquor by the individual drink with a 30 percent food sales requirement.[14]
Education
Unified school districts
Communities

Cities
Unincorporated communities
Townships
Linn County is divided into eleven townships. None of the cities within the county are considered governmentally independent, and all figures for the townships include those of the cities. In the following table, the population center is the largest city (or cities) included in that township's population total, if it is of a significant size.
| Township | FIPS | Population center |
Population | Population density /km² (/sq mi) |
Land area km² (sq mi) | Water area km² (sq mi) | Water % | Geographic coordinates |
|---|---|---|---|---|---|---|---|---|
| Blue Mound | 07625 | 500 | 3 (8) | 162 (63) | 0 (0) | 0.09% | 38°5′37″N 95°0′45″W / 38.09361°N 95.01250°W | |
| Centerville | 12350 | 389 | 2 (5) | 206 (79) | 0 (0) | 0.07% | 38°12′39″N 94°59′56″W / 38.21083°N 94.99889°W | |
| Liberty | 40200 | 908 | 5 (14) | 166 (64) | 0 (0) | 0.17% | 38°19′38″N 94°59′26″W / 38.32722°N 94.99056°W | |
| Lincoln | 40825 | 2,251 | 18 (47) | 125 (48) | 11 (4) | 7.84% | 38°21′10″N 94°43′10″W / 38.35278°N 94.71944°W | |
| Mound City | 48775 | 1,421 | 11 (29) | 129 (50) | 0 (0) | 0.16% | 38°7′59″N 94°48′59″W / 38.13306°N 94.81639°W | |
| Paris | 54375 | 494 | 3 (8) | 167 (65) | 0 (0) | 0.11% | 38°13′49″N 94°50′1″W / 38.23028°N 94.83361°W | |
| Potosi | 57175 | 2,080 | 14 (37) | 144 (56) | 1 (0) | 0.52% | 38°10′35″N 94°42′20″W / 38.17639°N 94.70556°W | |
| Scott | 63550 | 641 | 4 (10) | 163 (63) | 1 (0) | 0.73% | 38°18′32″N 94°51′13″W / 38.30889°N 94.85361°W | |
| Sheridan | 64700 | 560 | 5 (13) | 116 (45) | 0 (0) | 0.19% | 38°4′7″N 94°41′9″W / 38.06861°N 94.68583°W | |
| Stanton | 67875 | 169 | 2 (6) | 78 (30) | 0 (0) | 0.04% | 38°3′33″N 94°49′58″W / 38.05917°N 94.83278°W | |
| Valley | 72925 | 157 | 2 (4) | 94 (36) | 6 (2) | 5.91% | 38°16′7″N 94°41′41″W / 38.26861°N 94.69472°W | |
| Sources: "Census 2000 U.S. Gazetteer Files". U.S. Census Bureau, Geography Division. Archived from the original on 2002-08-02. | ||||||||
See also
|
|
References
- ↑ Charles Hadsall house at the Marais des Cygnes Massacre State Historic Site, Linn County, Kansas
- 1 2 "State & County QuickFacts". United States Census Bureau. Archived from the original on July 14, 2011. Retrieved July 26, 2014.
- ↑ "Find a County". National Association of Counties. Retrieved 2011-06-07.
- ↑ Blackmar, Frank Wilson (1912). Kansas: A Cyclopedia of State History, Volume 2. Standard Publishing Company. p. 166.
- ↑ Gannett, Henry (1905). The Origin of Certain Place Names in the United States. U.S. Government Printing Office. p. 187.
- ↑ "US Gazetteer files: 2010, 2000, and 1990". United States Census Bureau. 2011-02-12. Retrieved 2011-04-23.
- ↑ "Population and Housing Unit Estimates". Retrieved June 9, 2017.
- ↑ "U.S. Decennial Census". United States Census Bureau. Retrieved July 26, 2014.
- ↑ "Historical Census Browser". University of Virginia Library. Retrieved July 26, 2014.
- ↑ "Population of Counties by Decennial Census: 1900 to 1990". United States Census Bureau. Retrieved July 26, 2014.
- ↑ "Census 2000 PHC-T-4. Ranking Tables for Counties: 1990 and 2000" (PDF). United States Census Bureau. Retrieved July 26, 2014.
- ↑ "American FactFinder". United States Census Bureau. Retrieved 2008-01-31.
- ↑ http://uselectionatlas.org/RESULTS
- ↑ "Map of Wet and Dry Counties". Alcoholic Beverage Control, Kansas Department of Revenue. November 2006. Archived from the original on 2007-10-08. Retrieved 2007-12-26.
- Notes
- ↑ This total comprises 1,052 votes (29.4%) for Progressive Theodore Roosevelt and 389 votes (10.9%) for Socialist Eugene V. Debs.
- ↑ 2,063 votes (49.78%) were for Populist James B. Weaver (who was supported by the state’s Democrats) and 35 (0.84%) for Prohibition Party candidate John Bidwell.
Further reading
- Plat Book of Linn County, Kansas; North West Publishing Co; 44 pages; 1906.
External links
| Wikimedia Commons has media related to Linn County, Kansas. |
- County
- Other
- Linn County News (local newspaper)
- Maps
- Marion County Maps: Current, Historic, KDOT
- Kansas Highway Maps: Current, Historic, KDOT
- Kansas Railroad Maps: Current, 1996, 1915, KDOT and Kansas Historical Society
Places adjacent to Linn County, Kansas | |
|---|---|
Municipalities and communities of Linn County, Kansas, United States | ||
|---|---|---|
| Cities | | |
| Unincorporated communities | ||
| Ghost town | ||
Kansas City metropolitan area's cities and counties | ||
|---|---|---|
| Central city |  | |
| Largest cities (over 100,000 in 2000) | ||
| Medium-sized cities (10,000 to 100,000 in 2000) | ||
| Smaller Cities (between 5,000 and 9,900 in 2010) | ||
| Counties | ||
