Saline County, Kansas
| Saline County, Kansas | |
|---|---|
| County | |
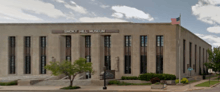 Smoky Hills Museum in Salina | |
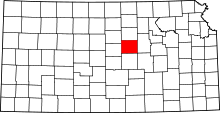 Location in the U.S. state of Kansas | |
 Kansas's location in the U.S. | |
| Founded | February 15, 1860 |
| Named for | Saline River |
| Seat | Salina |
| Largest city | Salina |
| Area | |
| • Total | 721 sq mi (1,867 km2) |
| • Land | 720 sq mi (1,865 km2) |
| • Water | 1.1 sq mi (3 km2), 0.2% |
| Population (est.) | |
| • (2016) | 55,142 |
| • Density | 77/sq mi (30/km2) |
| Congressional district | 1st |
| Time zone | Central: UTC−6/−5 |
| Website | Saline.org |
Saline County (standard abbreviation: SA) is a county located in the U.S. state of Kansas. As of the 2010 census, the county population was 55,606.[1] The largest city and county seat is Salina.[2]
History
Early history
For many millennia, the Great Plains of North America was inhabited by nomadic Native Americans. From the 16th century to 18th century, the Kingdom of France claimed ownership of large parts of North America. In 1762, after the French and Indian War, France secretly ceded New France to Spain, per the Treaty of Fontainebleau. In 1802, Spain returned most of the land to France, but keeping title to about 7,500 square miles.
In 1803, most of the land for modern day Kansas was acquired by the United States from France as part of the 828,000 square mile Louisiana Purchase for 2.83 cents per [cre. In 1848, after the Mexican–American War, the Treaty of Guadalupe Hidalgo with Spain brought into the United States all or part of land for ten future states, including southwest Kansas. In 1854, the Kansas Territory was organized, then in 1861 Kansas became the 34th U.S. state.
19th century
In 1860, Saline County was founded.
20th century
Saline County was a prohibition, or "dry", county until the Kansas Constitution was amended in 1986 and voters approved the sale of alcoholic liquor by the individual drink with a 30% food sales requirement. The food sales requirement was removed with voter approval in 1994.[3]
Geography
According to the U.S. Census Bureau, the county has a total area of 721 square miles (1,870 km2), of which 720 square miles (1,900 km2) is land and 1.1 square miles (2.8 km2) (0.2%) is water.[4]
Adjacent counties
- Ottawa County (north)
- Dickinson County (east)
- Marion County (southeast)
- McPherson County (south)
- Ellsworth County (west)
- Lincoln County (northwest)
Demographics
| Historical population | |||
|---|---|---|---|
| Census | Pop. | %± | |
| 1870 | 4,246 | — | |
| 1880 | 13,808 | 225.2% | |
| 1890 | 17,442 | 26.3% | |
| 1900 | 17,076 | −2.1% | |
| 1910 | 20,338 | 19.1% | |
| 1920 | 25,103 | 23.4% | |
| 1930 | 29,337 | 16.9% | |
| 1940 | 29,535 | 0.7% | |
| 1950 | 33,409 | 13.1% | |
| 1960 | 54,715 | 63.8% | |
| 1970 | 46,592 | −14.8% | |
| 1980 | 48,905 | 5.0% | |
| 1990 | 49,301 | 0.8% | |
| 2000 | 53,597 | 8.7% | |
| 2010 | 55,606 | 3.7% | |
| Est. 2016 | 55,142 | [5] | −0.8% |
| U.S. Decennial Census[6] 1790-1960[7] 1900-1990[8] 1990-2000[9] 2010-2016[1] | |||
Saline County is part of the Salina Micropolitan Statistical Area.[10]
As of the census[11] of 2000, there were 53,597 people, 21,436 households, and 14,212 families residing in the county. The population density was 74 people per square mile (29/km²). There were 22,695 housing units at an average density of 32 per square mile (12/km²). The racial makeup of the county was 89.17% White, 3.10% Black or African American, 0.52% Native American, 1.70% Asian, 0.04% Pacific Islander, 3.33% from other races, and 2.14% from two or more races. 6.02% of the population were Hispanic or Latino of any race.
There are 21,436 households in the county, out of which 32.10% have children under the age of 18 living with them, 52.90% were married couples living together, 9.70% had a female householder with no husband present, and 33.70% were non-families. 28.30% of all households were made up of individuals and 10.70% had someone living alone who was 65 years of age or older. The average household size was 2.43 and the average family size was 2.98.
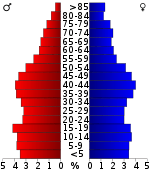
In the county, the population was spread out with 26.20% under the age of 18, 9.40% from 18 to 24, 28.40% from 25 to 44, 22.10% from 45 to 64, and 14.00% who were 65 years of age or older. The median age was 36 years. For every 100 females, there were 97.40 males. For every 100 females age 18 and over, there were 94.40 males.
The median income for a household in the county was $37,308, and the median income for a family was $46,362. Males had a median income of $31,509 versus $22,047 for females. The per capita income for the county was $19,073. About 6.00% of families and 8.80% of the population were below the poverty line, including 9.60% of those under age 18 and 8.80% of those age 65 or over.
Government
Board of Commissioners
Saline County is governed by a Board of Commissioners. The commission enacts the annual budget for the county, currently set at about $38,000,000, creates policy to be implemented by the county administrator, approves contracts, and oversees legislation relating to the health, safety, and well-being of the county's citizens.[12]
The Board of Commissioners has three members, one elected from each of the three commission districts. Commissioners are elected on a partisan basis.[12] The districts are reapportioned every three years, with the three districts being equally populated. Term lengths are four years.[12]
Current representatives on the Board of Commissioners are John Price (District 3; vice chairman), Monte Shadwick (District 1; secretary), and Jim Gile (District 2; chairman).[12] In 2014, citizens voted to change the number of commissioners from three to five. The group, “Drive for 5”, successfully campaigned for better representation of the people. Monte Shadwick easily won against long time commissioner Randy Duncan.
Governor Sam Brownback is now tasked with appointing the two new commission members that will serve for two years and then be up for election by the people. On January 12, 2015, Luci Larson and Dave Smith were appointed to the newly created 4th and 5th Districts.[13]
County administrator
The county administrator is hired by the Board of Commissioners and is the administrative officer for the county. The administrator is responsible for researching administrative and operational issues and then presenting suggestions for improvement in government efficiency to the Board of Commissioners and for reviewing all requests for action brought to the Board of Commissioners. The county administrator also implements policies enacted by the Board of Commissioners, prepares the annual budget, and "supervises accounts payable, payroll, human resource division and central purchasing for the county."[14] As needed, the county administrator will represent the county on boards and commissions.[14]
The current county administrator is Rita Deister.[14]
Presidential elections
| Year | Republican | Democratic | Third Parties |
|---|---|---|---|
| 2016 | 62.7% 13,828 | 28.6% 6,317 | 8.7% 1,919 |
| 2012 | 64.4% 13,840 | 32.8% 7,040 | 2.9% 616 |
| 2008 | 62.2% 14,165 | 35.9% 8,186 | 1.9% 437 |
| 2004 | 65.6% 15,111 | 32.7% 7,524 | 1.8% 406 |
| 2000 | 57.7% 12,412 | 34.8% 7,487 | 7.6% 1,628 |
| 1996 | 55.3% 12,475 | 34.3% 7,728 | 10.4% 2,338 |
| 1992 | 36.3% 8,565 | 33.4% 7,890 | 30.3% 7,168 |
| 1988 | 58.0% 11,371 | 40.8% 7,998 | 1.3% 249 |
| 1984 | 69.4% 15,244 | 29.7% 6,526 | 0.9% 191 |
| 1980 | 60.3% 12,758 | 30.2% 6,382 | 9.6% 2,029 |
| 1976 | 55.8% 11,218 | 42.2% 8,476 | 2.1% 413 |
| 1972 | 68.7% 12,592 | 29.5% 5,406 | 1.8% 321 |
| 1968 | 55.4% 9,324 | 37.4% 6,286 | 7.2% 1,212 |
| 1964 | 39.9% 6,533 | 59.5% 9,725 | 0.6% 99 |
| 1960 | 62.7% 11,023 | 37.0% 6,495 | 0.3% 50 |
| 1956 | 69.3% 11,172 | 30.5% 4,908 | 0.2% 37 |
| 1952 | 75.1% 12,326 | 24.4% 4,003 | 0.5% 80 |
| 1948 | 53.1% 7,928 | 45.6% 6,798 | 1.3% 194 |
| 1944 | 59.5% 7,571 | 40.1% 5,097 | 0.4% 55 |
| 1940 | 54.7% 7,975 | 44.7% 6,514 | 0.6% 92 |
| 1936 | 43.4% 6,061 | 56.3% 7,872 | 0.4% 50 |
| 1932 | 41.2% 5,265 | 55.7% 7,118 | 3.1% 389 |
| 1928 | 71.2% 7,872 | 28.1% 3,108 | 0.7% 76 |
| 1924 | 62.2% 6,534 | 18.7% 1,966 | 19.1% 2,005 |
| 1920 | 64.4% 5,554 | 32.6% 2,808 | 3.0% 260 |
| 1916 | 43.3% 3,984 | 52.8% 4,860 | 4.0% 368 |
| 1912 | 11.2% 534 | 47.2% 2,263 | 41.6% 1,994 |
| 1908 | 50.2% 2,297 | 46.6% 2,134 | 3.3% 149 |
| 1904 | 70.4% 2,797 | 20.1% 798 | 9.6% 381 |
| 1900 | 49.7% 2,245 | 48.7% 2,199 | 1.7% 76 |
| 1896 | 42.0% 1,706 | 57.5% 2,334 | 0.5% 21 |
| 1892 | 45.2% 1,817 | 54.8% 2,206 | |
| 1888 | 58.0% 2,263 | 30.4% 1,186 | 11.7% 455 |
Saline County is a Republican stronghold: the last Democrat to win a majority in the county was Lyndon Johnson in 1964, who was also the last Democrat to carry the state’s electoral votes. Saline has voted for the statewide winner in every presidential election since 1872, including for James Weaver in 1892.[16]
Education
Public schools
- USD 305, Salina
- Salina, Rural Areas
- USD 306, Southeast Of Saline
- Assaria, Bridgeport, Gypsum, Kipp, Mentor, Rural Areas
- USD 307, Ell-Saline
- Brookville, Bavaria, Hedville, Rural Areas
- District Office in neighboring county
- USD 240, Twin Valley (headquarters in Bennington)
- Glendale, Rural Areas
- USD 393, Solomon
- New Cambria, Rural Areas
- USD 400, Smoky Valley (headquarters in Lindsborg)
- Falun, Salemsborg, Smolan, Rural Areas
Private schools
Colleges and universities
Communities

Cities
- Assaria
- Brookville
- Gypsum
- New Cambria
- Salina
- Smolan
- Solomon (partly in Dickinson County)
Census-designated places
Other unincorporated communities
Townships
Saline County is divided into eighteen townships. The city of Salina is considered governmentally independent and is excluded from the census figures for the townships. In the following table, the population center is the largest city (or cities) included in that township's population total, if it is of a significant size.
See also
|
|
References
- 1 2 "State & County QuickFacts". United States Census Bureau. Retrieved July 29, 2014.
- ↑ "Find a County". National Association of Counties. Retrieved 2011-06-07.
- ↑ "Map of Wet and Dry Counties". Alcoholic Beverage Control, Kansas Department of Revenue. November 2006. Archived from the original on 2007-10-08. Retrieved 2007-12-28.
- ↑ "US Gazetteer files: 2010, 2000, and 1990". United States Census Bureau. 2011-02-12. Retrieved 2011-04-23.
- ↑ "Population and Housing Unit Estimates". Retrieved June 9, 2017.
- ↑ "U.S. Decennial Census". United States Census Bureau. Retrieved July 29, 2014.
- ↑ "Historical Census Browser". University of Virginia Library. Retrieved July 29, 2014.
- ↑ "Population of Counties by Decennial Census: 1900 to 1990". United States Census Bureau. Retrieved July 29, 2014.
- ↑ "Census 2000 PHC-T-4. Ranking Tables for Counties: 1990 and 2000" (PDF). United States Census Bureau. Retrieved July 29, 2014.
- ↑ Nussle, Jim (2008-11-20). "Micropolitan Statistical Areas" (PDF). List 1-9. Office of Management and Budget, Executive Office of the President. p. 97. Retrieved 2010-04-02.
- ↑ "American FactFinder". United States Census Bureau. Retrieved 2008-01-31.
- 1 2 3 4 "Saline County - Board of Commissioners". Saline County, Kansas. Archived from the original on 2012-03-30. Retrieved 2011-01-21.
- ↑ http://salina.com/news/new-commissioners-respond-to-county-issues/article_4441b2da-7066-5250-9654-400658f7b1bf.html
- 1 2 3 "Administrator". Saline County, Kansas. Archived from the original on 2012-04-30. Retrieved 2011-01-21.
- ↑ http://uselectionatlas.org/RESULTS
- ↑ The Political Graveyard: Saline County, Kansas
Further reading
- Portrait and Biographical Record of Dickinson, Saline, McPherson, and Marion Counties, Kansas; Chapman Bros; 614 pages; 1893.
- Standard Atlas of Saline County, Kansas; Geo. A. Ogle & Co; 71 pages; 1920.
- Plat Book of Saline County, Kansas; North West Publishing Co; 40 pages; 1903.
- Edwards' Atlas of Saline County, Kansas; John P. Edwards; 42 pages; 1884.
External links
| Wikimedia Commons has media related to Saline County, Kansas. |
- County
- Maps
- Saline County Maps: Current, Historic, KDOT
- Kansas Highway Maps: Current, Historic, KDOT
- Kansas Railroad Maps: Current, 1996, 1915, KDOT and Kansas Historical Society
Places adjacent to Saline County, Kansas | ||||||||||
|---|---|---|---|---|---|---|---|---|---|---|
| ||||||||||
Municipalities and communities of Saline County, Kansas, United States | ||
|---|---|---|
| Cities | | |
| CDPs | ||
| Unincorporated communities | ||
| Townships |
| |
| Footnotes | ‡This populated place also has portions in an adjacent county or counties | |
