Leavenworth County, Kansas
| Leavenworth County, Kansas | |
|---|---|
| County | |
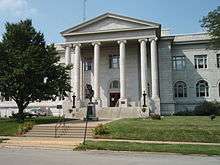 Leavenworth County Courthouse in Leavenworth | |
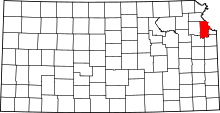 Location in the U.S. state of Kansas | |
 Kansas's location in the U.S. | |
| Founded | August 25, 1855 |
| Named for | Henry Leavenworth |
| Seat | Leavenworth |
| Largest city | Leavenworth |
| Area | |
| • Total | 469 sq mi (1,215 km2) |
| • Land | 463 sq mi (1,199 km2) |
| • Water | 6.1 sq mi (16 km2), 1.3% |
| Population (est.) | |
| • (2016) | 80,204 |
| • Density | 165/sq mi (64/km2) |
| Congressional district | 2nd |
| Time zone | Central: UTC−6/−5 |
| Website | LeavenworthCounty.org |
Leavenworth County (county code LV) is a county located in the U.S. state of Kansas. As of the 2010 census, the county population was 76,227.[1] Its county seat and most populous city is Leavenworth.[2]
History
Early history
For many millennia, the Great Plains of North America was inhabited by nomadic Native Americans. From the 16th century to 18th century, the Kingdom of France claimed ownership of large parts of North America. In 1762, after the French and Indian War, France secretly ceded New France to Spain, per the Treaty of Fontainebleau.
19th century
In 1802, Spain returned most of the land to France, but keeping title to about 7,500 square miles. In 1803, most of the land for modern day Kansas was acquired by the United States from France as part of the 828,000 square mile Louisiana Purchase for 2.83 cents per acre.
In 1854, the Kansas Territory was organized, then in 1861 Kansas became the 34th U.S. state. In 1855, Leavenworth County was established, and is among the first 33 counties, which were formed by the first territorial government. It was named, as was its county seat, after Henry Leavenworth, an officer in the War of 1812.[3]
Leavenworth County had the first Kansas State University extension agent in the State.
Geography
According to the U.S. Census Bureau, the county has a total area of 469 square miles (1,210 km2), of which 463 square miles (1,200 km2) is land and 6.1 square miles (16 km2) (1.3%) is water.[4] It is the fifth-smallest county in Kansas by total area.
This county's watershed connects with both the Kansas River basin on the south via Stranger Creek and has a Missouri River port city to the east.[5][6]
Adjacent counties
- Platte County, Missouri (north)
- Wyandotte County (east)
- Johnson County (southeast)
- Douglas County (southwest)
- Jefferson County (west)
- Atchison County (northwest)
Demographics
| Historical population | |||
|---|---|---|---|
| Census | Pop. | %± | |
| 1860 | 12,606 | — | |
| 1870 | 32,444 | 157.4% | |
| 1880 | 32,355 | −0.3% | |
| 1890 | 38,485 | 18.9% | |
| 1900 | 40,940 | 6.4% | |
| 1910 | 41,207 | 0.7% | |
| 1920 | 38,402 | −6.8% | |
| 1930 | 42,673 | 11.1% | |
| 1940 | 41,112 | −3.7% | |
| 1950 | 42,361 | 3.0% | |
| 1960 | 48,524 | 14.5% | |
| 1970 | 53,340 | 9.9% | |
| 1980 | 54,809 | 2.8% | |
| 1990 | 64,371 | 17.4% | |
| 2000 | 68,691 | 6.7% | |
| 2010 | 76,227 | 11.0% | |
| Est. 2016 | 80,204 | [7] | 5.2% |
| U.S. Decennial Census[8] 1790-1960[9] 1900-1990[10] 1990-2000[11] 2010-2016[1] | |||

The county is a part of the Kansas City, MO-KS Metropolitan Statistical Area.
As of the U.S. Census in 2000,[12] there were 68,691 people, 23,071 households, and 17,210 families residing in the county. The population density was 148 people per square mile (57/km²). There were 24,401 housing units at an average density of 53 per square mile (20/km²). The racial makeup of the county was 84.2% White, 10.4% Black or African American, 0.7% Native American, 1.1% Asian, 0.1% Pacific Islander, 1.2% from other races, and 2.2% from two or more races. Hispanic or Latino of any race were 3.8% of the population.
There were 23,071 households out of which 38.9% had children under the age of 18 living with them, 61.4% were married couples living together, 9.5% had a female householder with no husband present, and 25.4% were non-families. 21.7% of all households were made up of individuals and 8.1% had someone living alone who was 65 years of age or older. The average household size was 2.69 and the average family size was 3.15.
In the county, the population was spread out with 26.7% under the age of 18, 8.2% from 18 to 24, 33.0% from 25 to 44, 22.2% from 45 to 64, and 9.8% who were 65 years of age or older. The median age was 36 years. For every 100 females there were 113.50 males. For every 100 females age 18 and over, there were 116.90 males.
The median income for a household in the county was $48,114, and the median income for a family was $55,805. Males had a median income of $40,047 versus $26,029 for females. The per capita income for the county was $20,292. About 4.8% of families and 6.7% of the population were below the poverty line, including 8.8% of those under age 18 and 7.5% of those age 65 or over.
Government
Presidential elections
| Year | Republican | Democratic | Third Parties |
|---|---|---|---|
| 2016 | 57.6% 17,638 | 33.3% 10,209 | 9.1% 2,792 |
| 2012 | 58.7% 17,059 | 39.1% 11,357 | 2.3% 669 |
| 2008 | 54.9% 16,791 | 43.3% 13,255 | 1.8% 545 |
| 2004 | 58.4% 15,949 | 40.4% 11,039 | 1.3% 343 |
| 2000 | 54.1% 12,583 | 41.8% 9,733 | 4.1% 955 |
| 1996 | 47.9% 10,778 | 40.4% 9,098 | 11.7% 2,624 |
| 1992 | 33.4% 7,738 | 34.9% 8,077 | 31.8% 7,357 |
| 1988 | 52.5% 9,913 | 46.6% 8,797 | 0.9% 160 |
| 1984 | 62.3% 11,194 | 36.8% 6,604 | 1.0% 172 |
| 1980 | 55.0% 9,157 | 38.2% 6,354 | 6.9% 1,145 |
| 1976 | 50.1% 8,407 | 47.8% 8,022 | 2.1% 349 |
| 1972 | 67.7% 10,762 | 29.7% 4,727 | 2.6% 408 |
| 1968 | 48.4% 7,081 | 37.9% 5,546 | 13.8% 2,018 |
| 1964 | 42.4% 5,544 | 57.1% 7,479 | 0.5% 66 |
| 1960 | 53.1% 7,870 | 46.7% 6,926 | 0.2% 36 |
| 1956 | 61.6% 8,826 | 38.2% 5,480 | 0.2% 33 |
| 1952 | 61.2% 9,046 | 38.5% 5,698 | 0.3% 39 |
| 1948 | 48.6% 6,474 | 50.6% 6,740 | 0.8% 103 |
| 1944 | 58.6% 7,282 | 41.0% 5,097 | 0.5% 59 |
| 1940 | 58.3% 8,503 | 41.5% 6,053 | 0.3% 42 |
| 1936 | 51.4% 8,532 | 48.2% 7,996 | 0.4% 73 |
| 1932 | 40.2% 6,484 | 59.0% 9,507 | 0.8% 123 |
| 1928 | 56.3% 8,472 | 43.4% 6,539 | 0.3% 45 |
| 1924 | 68.1% 9,429 | 21.5% 2,982 | 10.4% 1,445 |
| 1920 | 65.1% 6,846 | 32.4% 3,409 | 2.6% 269 |
| 1916 | 45.5% 5,536 | 49.3% 6,002 | 5.3% 640 |
| 1912 | 33.1% 2,562 | 40.0% 3,099 | 27.0% 2,092 |
| 1908 | 53.9% 4,846 | 42.4% 3,818 | 3.7% 332 |
| 1904 | 64.2% 5,771 | 30.9% 2,775 | 5.0% 450 |
| 1900 | 49.8% 4,162 | 49.2% 4,109 | 1.0% 80 |
| 1896 | 45.8% 4,004 | 53.4% 4,665 | 0.8% 68 |
| 1892 | 47.0% 3,471 | 53.0% 3,921 | |
| 1888 | 45.5% 3,272 | 48.9% 3,516 | 5.7% 406 |
Laws
Leavenworth County was a prohibition, or "dry", county until the Kansas Constitution was amended in 1986 and voters approved the sale of alcoholic liquor by the individual drink with a 30 percent food sales requirement.[14]
Education
Unified school districts
Colleges and universities
Communities
Cities
- Basehor
- Bonner Springs (part)
- De Soto (part)
- Easton
- Kansas City (part)
- Lansing
- Leavenworth
- Linwood
- Tonganoxie
Unincorporated communities
Townships
Leavenworth County is divided into ten townships. The cities of Lansing and Leavenworth are considered governmentally independent and are excluded from the census figures for the townships. In the following table, the population center is the largest city (or cities) included in that township's population total, if it is of a significant size.
| Township | FIPS | Population center |
Population | Population density /km² (/sq mi) |
Land area km² (sq mi) | Water area km² (sq mi) | Water % | Geographic coordinates |
|---|---|---|---|---|---|---|---|---|
| Alexandria | 01100 | 859 | 7 (18) | 123 (48) | 1 (0) | 0.62% | 39°16′8″N 95°7′33″W / 39.26889°N 95.12583°W | |
| Delaware | 17450 | 1,361 | 22 (57) | 62 (24) | 3 (1) | 4.19% | 39°14′50″N 94°52′40″W / 39.24722°N 94.87778°W | |
| Easton | 19625 | 1,245 | 11 (30) | 109 (42) | 0 (0) | 0.11% | 39°21′57″N 95°7′27″W / 39.36583°N 95.12417°W | |
| Fairmount | 22325 | Basehor | 6,266 | 61 (159) | 102 (39) | 0 (0) | 0.39% | 39°8′4″N 94°56′26″W / 39.13444°N 94.94056°W |
| High Prairie | 32125 | 1,768 | 14 (37) | 124 (48) | 0 (0) | 0.27% | 39°15′30″N 95°0′34″W / 39.25833°N 95.00944°W | |
| Kickapoo | 36700 | 1,760 | 15 (40) | 114 (44) | 3 (1) | 2.39% | 39°20′45″N 94°59′29″W / 39.34583°N 94.99139°W | |
| Reno | 58950 | 1,143 | 10 (27) | 111 (43) | 2 (1) | 1.56% | 39°1′8″N 95°8′8″W / 39.01889°N 95.13556°W | |
| Sherman | 65000 | 2,367 | 22 (57) | 108 (42) | 3 (1) | 2.44% | 39°0′59″N 95°0′27″W / 39.01639°N 95.00750°W | |
| Stranger | 68500 | 2,451 | 19 (50) | 127 (49) | 0 (0) | 0.17% | 39°8′16″N 95°2′2″W / 39.13778°N 95.03389°W | |
| Tonganoxie | 70825 | Tonganoxie (part) | 4,852 | 35 (91) | 137 (53) | 1 (0) | 0.66% | 39°7′0″N 95°6′35″W / 39.11667°N 95.10972°W |
| Sources: "Census 2000 U.S. Gazetteer Files". U.S. Census Bureau, Geography Division. Archived from the original on 2002-08-02. | ||||||||
Notable people
- Sean Malto, professional skateboarder
- Wayne Simien, professional basketball player
See also
- National Register of Historic Places listings in Leavenworth County, Kansas
- Lenape & Christian Munsee
- Ernest Fox Nichols - Educator & MIT physicist
- Fort Leavenworth (Frontier Army Museum)
- Freedom's Frontier, NE Kansas National Heritage Area
- Kansas Sampler, shares insights on community character
|
|
References
- 1 2 "State & County QuickFacts". United States Census Bureau. Archived from the original on July 13, 2011. Retrieved July 26, 2014.
- ↑ "Find a County". National Association of Counties. Retrieved 2011-06-07.
- ↑ Gannett, Henry (1905). The Origin of Certain Place Names in the United States. U.S. Government Printing Office. p. 183.
- ↑ "US Gazetteer files: 2010, 2000, and 1990". United States Census Bureau. 2011-02-12. Retrieved 2011-04-23.
- ↑ Big Stranger Creek Rogers, H.D., and Johnson, A. Keith. Kansas and Indian territory in The Atlas of the U.S. of North America, Canada, New Brunswick, Nova Scotia, Newfoundland, Mexico, Central America, Cuba and Jamaica . London: E. Stanford, 1857 (no scale). A historical reference showing the Kansas Territory including parts of Colorado. Shows the westward trails.
- ↑ Lower Kansas (Surf Your Watershed)
- ↑ "Population and Housing Unit Estimates". Retrieved June 9, 2017.
- ↑ "U.S. Decennial Census". United States Census Bureau. Retrieved July 26, 2014.
- ↑ "Historical Census Browser". University of Virginia Library. Retrieved July 26, 2014.
- ↑ "Population of Counties by Decennial Census: 1900 to 1990". United States Census Bureau. Retrieved July 26, 2014.
- ↑ "Census 2000 PHC-T-4. Ranking Tables for Counties: 1990 and 2000" (PDF). United States Census Bureau. Retrieved July 26, 2014.
- ↑ "American FactFinder". United States Census Bureau. Retrieved 2008-01-31.
- ↑ http://uselectionatlas.org/RESULTS
- ↑ "Map of Wet and Dry Counties". Alcoholic Beverage Control, Kansas Department of Revenue. November 2006. Archived from the original on 2007-10-08. Retrieved 2007-12-28.
Further reading
- History of Leavenworth County Kansas; Jesse Hall and LeRoy Hand; Historical Publishing; 684 pages; 1921.
- Standard Atlas of Leavenworth County, Kansas; Geo. A. Ogle & Co; 42 pages; 1903.
- Atlas Map of Leavenworth County, Kansas; Missouri Publishing Co; 38 pages; 1878.
External links
| Wikimedia Commons has media related to Leavenworth County, Kansas. |
| Wikisource has the text of an 1879 American Cyclopædia article about Leavenworth County, Kansas. |
- County
- Leavenworth County - Official
- Leavenworth County - Directory of Public Officials
- Leavenworth County - Development Corporation
- Maps
- Leavenworth County Maps: Current, Historic, KDOT
- Kansas Highway Maps: Current, Historic, KDOT
- Kansas Railroad Maps: Current, 1996, 1915, KDOT and Kansas Historical Society
Places adjacent to Leavenworth County, Kansas | ||||||||||
|---|---|---|---|---|---|---|---|---|---|---|
| ||||||||||
Municipalities and communities of Leavenworth County, Kansas, United States | ||
|---|---|---|
| Cities | | |
| CDPs | ||
| Unincorporated communities | ||
| Townships | ||
| Ghost town | ||
| Footnotes | ‡This populated place also has portions in an adjacent county or counties | |
Kansas City metropolitan area's cities and counties | ||
|---|---|---|
| Central city |  | |
| Largest cities (over 100,000 in 2000) | ||
| Medium-sized cities (10,000 to 100,000 in 2000) | ||
| Smaller Cities (between 5,000 and 9,900 in 2010) | ||
| Counties | ||
