Pottawatomie County, Kansas
| Pottawatomie County, Kansas | |
|---|---|
| County | |
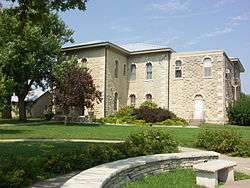 Pottawatomie County Courthouse in Westmoreland (2009) | |
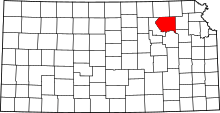 Location in the U.S. state of Kansas | |
 Kansas's location in the U.S. | |
| Founded | February 20, 1857 |
| Named for | Potawatomi people |
| Seat | Westmoreland |
| Largest city | Manhattan |
| Area | |
| • Total | 862 sq mi (2,233 km2) |
| • Land | 841 sq mi (2,178 km2) |
| • Water | 21 sq mi (54 km2), 2.4% |
| Population (est.) | |
| • (2016) | 23,661 |
| • Density | 26/sq mi (10/km2) |
| Congressional district | 1st |
| Time zone | Central: UTC−6/−5 |
| Website | pottcounty.org |
Pottawatomie County (standard abbreviation: PT) is a county located in the U.S. state of Kansas. As of the 2010 census, the county population was 21,604.[1] The county seat is Westmoreland.[2] The county takes its name from the Potawatomi tribe of Native Americans.
History
Early history
For millennia, the Great Plains of North America were inhabited by nomadic Native Americans. From the 16th to 18th centuries, the Kingdom of France claimed ownership of large parts of North America. In 1762, after the French and Indian War, France secretly ceded New France to Spain, by the Treaty of Fontainebleau.
19th century
In 1802, Spain returned most of the land to France, keeping title to about 7,500 square miles. In 1803, most of the land for modern day Kansas was acquired by the United States from France as part of the 828,000 square mile Louisiana Purchase.
In 1854, the Kansas Territory was organized under the provisions of the Kansas-Nebraska Act, then in 1861 Kansas became the 34th U.S. state.
In 1857, Pottawatomie County was established by the Kansas Territorial legislature, out of land formerly included in Riley County. The present county seat of Westmoreland was selected by a vote held in 1882.
Geography
According to the U.S. Census Bureau, the county has a total area of 862 square miles (2,230 km2), of which 841 square miles (2,180 km2) is land and 21 square miles (54 km2) (2.4%) is water.[3]
Adjacent counties
- Marshall County (north)
- Nemaha County (northeast)
- Jackson County (east)
- Shawnee County (southeast)
- Wabaunsee County (south)
- Riley County (west)
Demographics
| Historical population | |||
|---|---|---|---|
| Census | Pop. | %± | |
| 1860 | 1,529 | — | |
| 1870 | 7,848 | 413.3% | |
| 1880 | 16,350 | 108.3% | |
| 1890 | 17,722 | 8.4% | |
| 1900 | 18,470 | 4.2% | |
| 1910 | 17,522 | −5.1% | |
| 1920 | 16,154 | −7.8% | |
| 1930 | 15,862 | −1.8% | |
| 1940 | 14,015 | −11.6% | |
| 1950 | 12,344 | −11.9% | |
| 1960 | 11,957 | −3.1% | |
| 1970 | 11,755 | −1.7% | |
| 1980 | 14,782 | 25.8% | |
| 1990 | 16,128 | 9.1% | |
| 2000 | 18,209 | 12.9% | |
| 2010 | 21,604 | 18.6% | |
| Est. 2016 | 23,661 | [4] | 9.5% |
| U.S. Decennial Census[5] 1790-1960[6] 1900-1990[7] 1990-2000[8] 2010-2016[1] | |||
Pottawatomie County is part of the Manhattan Metropolitan Statistical Area.
As of the census[9] of 2000, there were 18,209 people, 6,771 households, and 4,929 families residing in the county. The population density was 22 people per square mile (8/km²). There were 7,311 housing units at an average density of 9 per square mile (3/km²). The racial makeup of the county was 96.32% White, 0.66% Black or African American, 0.59% Native American, 0.32% Asian, 0.01% Pacific Islander, 0.60% from other races, and 1.50% from two or more races. 2.26% of the population were Hispanic or Latino of any race.
There were 6,771 households out of which 36.40% had children under the age of 18 living with them, 62.40% were married couples living together, 7.20% had a female householder with no husband present, and 27.20% were non-families. 23.20% of all households were made up of individuals and 9.70% had someone living alone who was 65 years of age or older. The average household size was 2.65 and the average family size was 3.15.
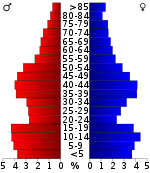
In the county, the population was spread out with 29.50% under the age of 18, 7.70% from 18 to 24, 27.70% from 25 to 44, 21.60% from 45 to 64, and 13.50% who were 65 years of age or older. The median age was 36 years. For every 100 females, there were 98.00 males. For every 100 females age 18 and over, there were 96.70 males.
The median income for a household in the county was $40,176, and the median income for a family was $47,261. Males had a median income of $31,368 versus $23,238 for females. The per capita income for the county was $17,785. About 6.40% of families and 9.70% of the population were below the poverty line, including 14.10% of those under age 18 and 10.30% of those age 65 or over.
Government
Presidential elections
| Year | Republican | Democratic | Third Parties |
|---|---|---|---|
| 2016 | 71.2% 7,612 | 20.8% 2,225 | 8.0% 856 |
| 2012 | 71.8% 6,804 | 24.6% 2,335 | 3.6% 340 |
| 2008 | 70.2% 6,929 | 26.3% 2,599 | 3.5% 349 |
| 2004 | 71.7% 6,326 | 24.7% 2,176 | 3.6% 321 |
| 2000 | 64.5% 4,985 | 26.4% 2,037 | 9.2% 709 |
| 1996 | 58.2% 4,504 | 25.8% 1,997 | 16.1% 1,243 |
| 1992 | 38.9% 3,106 | 26.3% 2,099 | 34.9% 2,785 |
| 1988 | 59.5% 3,897 | 38.9% 2,544 | 1.7% 108 |
| 1984 | 71.1% 4,598 | 27.8% 1,798 | 1.1% 72 |
| 1980 | 63.4% 3,895 | 28.1% 1,724 | 8.6% 525 |
| 1976 | 59.1% 3,483 | 39.3% 2,316 | 1.7% 98 |
| 1972 | 73.5% 3,947 | 24.2% 1,298 | 2.3% 124 |
| 1968 | 63.7% 3,267 | 26.7% 1,368 | 9.7% 495 |
| 1964 | 51.4% 2,606 | 48.0% 2,432 | 0.6% 32 |
| 1960 | 63.2% 3,666 | 36.6% 2,125 | 0.2% 13 |
| 1956 | 75.0% 4,335 | 24.6% 1,422 | 0.4% 25 |
| 1952 | 77.9% 4,944 | 21.9% 1,387 | 0.2% 12 |
| 1948 | 62.6% 3,709 | 36.6% 2,167 | 0.8% 45 |
| 1944 | 70.0% 4,074 | 29.7% 1,727 | 0.3% 18 |
| 1940 | 69.1% 5,045 | 30.5% 2,226 | 0.4% 28 |
| 1936 | 53.8% 3,977 | 44.4% 3,284 | 1.9% 137 |
| 1932 | 45.5% 3,339 | 53.2% 3,910 | 1.3% 97 |
| 1928 | 65.3% 4,451 | 34.4% 2,341 | 0.4% 24 |
| 1924 | 68.3% 4,340 | 23.1% 1,471 | 8.6% 545 |
| 1920 | 77.0% 4,481 | 22.2% 1,293 | 0.8% 49 |
| 1916 | 55.7% 3,688 | 42.8% 2,834 | 1.6% 104 |
| 1912 | 25.1% 1,058 | 37.9% 1,599 | 37.0% 1,559 |
| 1908 | 60.8% 2,650 | 38.5% 1,680 | 0.7% 30 |
| 1904 | 69.9% 2,632 | 27.7% 1,045 | 2.4% 91 |
| 1900 | 56.4% 2,556 | 42.6% 1,929 | 1.0% 46 |
| 1896 | 50.0% 2,308 | 49.3% 2,276 | 0.8% 37 |
| 1892 | 49.8% 2,107 | 50.2% 2,124[lower-alpha 1] | |
| 1888 | 58.9% 2,419 | 35.8% 1,471 | 5.2% 214 |
Pottawatomie County is powerfully Republican. The only Democratic Presidential candidate to gain a majority in Pottawatomie County has been Franklin D. Roosevelt in 1932, while since 1940 only Lyndon Johnson in 1964 has received so much as forty percent of the county’s vote.
Laws
Pottawatomie County was a prohibition, or "dry", county until the Kansas Constitution was amended in 1986 and voters approved the sale of alcoholic liquor by the individual drink with a 30% food sales requirement.[11]
Education

Unified school districts
The Unified School Districts that serve Pottawatomie County include:
- Wamego USD 320 (Wamego, Louisville, Belvue)
- Kaw Valley USD 321 (St. Marys, Emmett)
- Onaga USD 322 (Onaga, Havensville, Wheaton)
- Rock Creek USD 323 (Westmoreland, St. George)
- Riley County USD 378 (West-Central Pottawatomie County)
- Manhattan-Ogden USD 383 (Southwest Pottawatomie County)
- Blue Valley USD 384 (Olsburg, Fostoria)
Private schools
- St. Marys Academy & College(St. Marys)
Communities
Cities
Prior to the creation of Tuttle Creek Lake, the town of Garrison existed in west central Pottawatomie County.
Townships
Pottawatomie County is divided into twenty-three townships. The city of Manhattan is considered governmentally independent and is excluded from the census figures for the townships. In the following table, the population center is the largest city (or cities) included in that township's population total, if it is of a significant size.
Notable people
Among the famous natives of Pottawatomie County are world heavyweight boxing champion Jess Willard and automobile manufacturer Walter Chrysler.
See also
|
|
References
- 1 2 "State & County QuickFacts". United States Census Bureau. Retrieved July 28, 2014.
- ↑ "Find a County". National Association of Counties. Retrieved 2011-06-07.
- ↑ "US Gazetteer files: 2010, 2000, and 1990". United States Census Bureau. 2011-02-12. Retrieved 2011-04-23.
- ↑ "Population and Housing Unit Estimates". Retrieved June 9, 2017.
- ↑ "U.S. Decennial Census". United States Census Bureau. Retrieved July 28, 2014.
- ↑ "Historical Census Browser". University of Virginia Library. Retrieved July 28, 2014.
- ↑ "Population of Counties by Decennial Census: 1900 to 1990". United States Census Bureau. Retrieved July 28, 2014.
- ↑ "Census 2000 PHC-T-4. Ranking Tables for Counties: 1990 and 2000" (PDF). United States Census Bureau. Retrieved July 28, 2014.
- ↑ "American FactFinder". United States Census Bureau. Retrieved 2008-01-31.
- ↑ http://uselectionatlas.org/RESULTS
- ↑ "Map of Wet and Dry Counties". Alcoholic Beverage Control, Kansas Department of Revenue. November 2006. Archived from the original on 2007-10-08. Retrieved 2007-12-28.
- Notes
- ↑ 2,101 votes (49.66 percent) were for Populist James B. Weaver (who was supported by the state’s Democrats) and 23 (0.54 percent) for Prohibition Party candidate John Bidwell.
Further reading
- Standard Atlas of Pottawatomie County, Kansas; Geo. A. Ogle & Co; 57 pages; 1905.
- Onaga Courier's Township Map of Pottawatomie County, Kansas; Onaga Courier; 59 pages; 1899.
External links
| Wikimedia Commons has media related to Pottawatomie County, Kansas. |
- County
- Pottawatomie County - Official Website
- Pottawatomie County - Directory of Public Officials
- Pottawatomie County Economic Development Corporation - PCEDC
- Maps
- Pottawatomie County Maps: Current, Historic, KDOT
- Kansas Highway Maps: Current, Historic, KDOT
- Kansas Railroad Maps: Current, 1996, 1915, KDOT and Kansas Historical Society
Places adjacent to Pottawatomie County, Kansas | ||||||||||
|---|---|---|---|---|---|---|---|---|---|---|
| ||||||||||
Municipalities and communities of Pottawatomie County, Kansas, United States | ||
|---|---|---|
| Cities | | |
| Unincorporated communities | ||
| Footnotes | ‡This populated place also has portions in an adjacent county or counties | |
