Bourbon County, Kansas
| Bourbon County, Kansas | |
|---|---|
| County | |
 Bourbon County Courthouse in Fort Scott | |
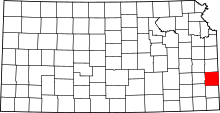 Location in the U.S. state of Kansas | |
 Kansas's location in the U.S. | |
| Coordinates: 37°51′N 94°51′W / 37.850°N 94.850°W | |
| Founded | August 25, 1855 |
| Named for | Bourbon County, Kentucky |
| Seat | Fort Scott |
| Largest city | Fort Scott |
| Area | |
| • Total | 639 sq mi (1,655 km2) |
| • Land | 635 sq mi (1,645 km2) |
| • Water | 3.6 sq mi (9 km2), 0.6% |
| Population (est.) | |
| • (2016) | 14,617 |
| • Density | 24/sq mi (9/km2) |
| Area code(s) | 620 |
| Congressional district | 2nd |
| Time zone | Central: UTC−6/−5 |
| Website | BourbonCountyKS.org |
Bourbon County (county code BB) is a county located in Southeast Kansas. As of the 2010 census, the county population was 15,173.[1] Its county seat and most populous city is Fort Scott.[2]
History
Early history
For many millennia, the Great Plains of North America was inhabited by nomadic Native Americans. From the 16th century to 18th century, the Kingdom of France claimed ownership of large parts of North America. In 1762, after the French and Indian War, France secretly ceded New France to Spain, per the Treaty of Fontainebleau.
19th century
In 1802, Spain returned most of the land to France, but keeping title to about 7,500 square miles. In 1803, most of the land for modern day Kansas was acquired by the United States from France as part of the 828,000 square mile Louisiana Purchase for 2.83 cents per acre.
In 1854, the Kansas Territory was organized, then in 1861 Kansas became the 34th U.S. state. In 1855, Bourbon County was established.
21st century
Bourbon virus, a new strain of thogotovirus, was first discovered in Bourbon County. In the spring of 2014 an otherwise healthy man was bitten by a tick, contracting the virus and died 11 days later from organ failure. [3][4]
Geography
According to the U.S. Census Bureau, the county has a total area of 639 square miles (1,660 km2), of which 635 square miles (1,640 km2) is land and 3.6 square miles (9.3 km2) (0.6%) is water.[5]
Adjacent counties
- Linn County (north)
- Vernon County, Missouri (east)
- Crawford County (south)
- Neosho County (southwest)
- Allen County (west)
- Anderson County (northwest)
National protected area
Major highways
Demographics
| Historical population | |||
|---|---|---|---|
| Census | Pop. | %± | |
| 1860 | 6,101 | — | |
| 1870 | 15,076 | 147.1% | |
| 1880 | 19,591 | 29.9% | |
| 1890 | 28,575 | 45.9% | |
| 1900 | 24,712 | −13.5% | |
| 1910 | 24,007 | −2.9% | |
| 1920 | 23,198 | −3.4% | |
| 1930 | 22,386 | −3.5% | |
| 1940 | 20,944 | −6.4% | |
| 1950 | 19,153 | −8.6% | |
| 1960 | 16,090 | −16.0% | |
| 1970 | 15,215 | −5.4% | |
| 1980 | 15,969 | 5.0% | |
| 1990 | 14,966 | −6.3% | |
| 2000 | 15,379 | 2.8% | |
| 2010 | 15,173 | −1.3% | |
| Est. 2016 | 14,617 | [8] | −3.7% |
| U.S. Decennial Census[9] 1790-1960[10] 1900-1990[11] 1990-2000[12] 2010-2016[1] | |||

As of the 2000 census,[13] there were 15,379 people, 6,161 households, and 4,127 families residing in the county. The population density was 24 people per square mile (9/km²). There were 7,135 housing units at an average density of 11 per square mile (4/km²). The racial makeup of the county was 94.06% White, 3.08% Black or African American, 0.84% Native American, 0.36% Asian, 0.05% Pacific Islander, 0.28% from other races, and 1.33% from two or more races. Hispanic or Latino of any race were 1.29% of the population.
There were 6,161 households out of which 30.50% had children under the age of 18 living with them, 54.50% were married couples living together, 9.20% had a female householder with no husband present, and 33.00% were non-families. 29.00% of all households were made up of individuals and 14.90% had someone living alone who was 65 years of age or older. The average household size was 2.44 and the average family size was 3.01.
In the county, the population was spread out with 25.80% under the age of 18, 9.50% from 18 to 24, 24.20% from 25 to 44, 22.30% from 45 to 64, and 18.20% who were 65 years of age or older. The median age was 38 years. For every 100 females there were 93.00 males. For every 100 females age 18 and over, there were 88.50 males.
The median income for a household in the county was $31,199, and the median income for a family was $39,239. Males had a median income of $27,043 versus $20,983 for females. The per capita income for the county was $16,393. About 9.50% of families and 13.50% of the population were below the poverty line, including 18.00% of those under age 18 and 13.40% of those age 65 or over.
Government
Presidential elections
| Year | Republican | Democratic | Third Parties |
|---|---|---|---|
| 2016 | 72.6% 4,424 | 21.9% 1,336 | 5.5% 333 |
| 2012 | 65.6% 4,102 | 31.9% 1,996 | 2.5% 156 |
| 2008 | 62.5% 4,240 | 35.3% 2,394 | 2.2% 147 |
| 2004 | 65.4% 4,372 | 33.1% 2,216 | 1.5% 98 |
| 2000 | 61.1% 3,852 | 35.1% 2,211 | 3.9% 245 |
| 1996 | 50.2% 3,318 | 37.7% 2,491 | 12.2% 805 |
| 1992 | 40.2% 2,876 | 35.1% 2,509 | 24.8% 1,774 |
| 1988 | 57.8% 3,660 | 41.4% 2,623 | 0.8% 49 |
| 1984 | 68.4% 4,858 | 30.6% 2,175 | 1.0% 69 |
| 1980 | 59.2% 4,263 | 36.2% 2,605 | 4.6% 331 |
| 1976 | 51.8% 3,589 | 46.7% 3,237 | 1.5% 103 |
| 1972 | 70.1% 4,776 | 28.1% 1,912 | 1.9% 126 |
| 1968 | 56.9% 3,983 | 32.0% 2,241 | 11.1% 780 |
| 1964 | 44.9% 3,290 | 54.4% 3,980 | 0.7% 53 |
| 1960 | 63.0% 5,062 | 36.5% 2,928 | 0.5% 41 |
| 1956 | 62.4% 5,306 | 37.1% 3,151 | 0.6% 47 |
| 1952 | 65.3% 5,785 | 34.1% 3,023 | 0.6% 56 |
| 1948 | 51.4% 4,225 | 47.2% 3,879 | 1.4% 111 |
| 1944 | 56.7% 4,790 | 42.9% 3,622 | 0.5% 39 |
| 1940 | 53.6% 5,751 | 45.7% 4,898 | 0.7% 78 |
| 1936 | 48.6% 5,402 | 51.4% 5,714 | 0.0% 4 |
| 1932 | 42.6% 4,277 | 55.6% 5,577 | 1.8% 181 |
| 1928 | 75.9% 7,251 | 23.3% 2,223 | 0.9% 82 |
| 1924 | 49.0% 4,210 | 33.2% 2,850 | 17.9% 1,538 |
| 1920 | 52.1% 4,194 | 45.1% 3,632 | 2.8% 225 |
| 1916 | 37.6% 3,370 | 58.1% 5,209 | 4.3% 388 |
| 1912 | 27.0% 1,448 | 41.3% 2,209 | 31.7% 1,698 |
| 1908 | 47.8% 2,695 | 47.7% 2,686 | 4.5% 253 |
| 1904 | 59.3% 3,234 | 33.1% 1,808 | 7.6% 415 |
| 1900 | 51.4% 3,024 | 47.5% 2,799 | 1.1% 65 |
| 1896 | 48.2% 2,900 | 51.0% 3,067 | 0.8% 50 |
| 1892 | 49.2% 2,803 | 50.8% 2,889 | |
| 1888 | 57.1% 3,569 | 29.3% 1,831 | 13.7% 854 |
Laws
Following amendment to the Kansas Constitution in 1986, the county remained a prohibition, or "dry", county until 1992, when voters approved the sale of alcoholic liquor by the individual drink with a 30% food sales requirement.[15]
Education
Unified school districts
Communities

Cities
Unincorporated communities
- Barnesville
- Berlin (no longer exists)
- Devon
- Garland
- Godfrey
- Hammond
- Harding
- Hiattville
- Hidden Valley
- Hollister (no longer exists)
- Marmaton
- Pawnee Station
- Ronald (Walkertown)
- Xenia
Townships
Bourbon County is divided into eleven townships. The city of Fort Scott is considered governmentally independent and is excluded from the census figures for the townships. In the following table, the population center is the largest city (or cities) included in that township's population total, if it is of a significant size.
Notable people
- Jonathan M. Davis, 22nd Governor of Kansas; born in Bourbon County.[16]
See also
|
|
References
- 1 2 "State & County QuickFacts". United States Census Bureau. Retrieved July 21, 2014.
- ↑ "Find a County". National Association of Counties. Archived from the original on 2011-05-31. Retrieved 2011-06-07.
- ↑ "New details on mystery virus that killed Kansas man". CBS News.
- ↑ "New so-called Bourbon virus linked to Kansas man's death after tick bite". UPI.
- ↑ "US Gazetteer files: 2010, 2000, and 1990". United States Census Bureau. 2011-02-12. Retrieved 2011-04-23.
- ↑ National Atlas Archived December 5, 2008, at the Wayback Machine.
- ↑ U.S. Census Bureau TIGER shape files
- ↑ "Population and Housing Unit Estimates". Retrieved June 9, 2017.
- ↑ "U.S. Decennial Census". United States Census Bureau. Archived from the original on May 12, 2015. Retrieved July 21, 2014.
- ↑ "Historical Census Browser". University of Virginia Library. Retrieved July 21, 2014.
- ↑ "Population of Counties by Decennial Census: 1900 to 1990". United States Census Bureau. Retrieved July 21, 2014.
- ↑ "Census 2000 PHC-T-4. Ranking Tables for Counties: 1990 and 2000" (PDF). United States Census Bureau. Retrieved July 21, 2014.
- ↑ "American FactFinder". United States Census Bureau. Archived from the original on 2013-09-11. Retrieved 2008-01-31.
- ↑ http://uselectionatlas.org/RESULTS
- ↑ "Map of Wet and Dry Counties". Alcoholic Beverage Control, Kansas Department of Revenue. November 2006. Archived from the original on 2007-10-08. Retrieved 2007-12-26.
- ↑ "Jonathan M. Davis". The Political Graveyard. Retrieved 30 September 2012.
Further reading
- Standard Atlas of Bourbon County, Kansas; Geo. A. Ogle & Co; 67 pages; 1920.
- History of Bourbon County, Kansas: To the Close of 1865; Thomas F. Robley; 269 pages; 1894.
- An Illustrated Historical Atlas of Bourbon County, Kansas; Edwards Brothers of Missouri; 55 pages; 1878.
External links
| Wikimedia Commons has media related to Bourbon County, Kansas. |
- County
- Maps
- Bourbon County Maps: Current, Historic, KDOT
- Kansas Highway Maps: Current, Historic, KDOT
- Kansas Railroad Maps: Current, 1996, 1915, KDOT and Kansas Historical Society
Places adjacent to Bourbon County, Kansas | |
|---|---|
Municipalities and communities of Bourbon County, Kansas, United States | ||
|---|---|---|
| Cities | | |
| Unincorporated communities | ||
| Townships | ||
