Riley County, Kansas
| Riley County, Kansas | |
|---|---|
| County | |
_County_Courthouse_1.jpg) Riley County Courthouse in Manhattan (2005) | |
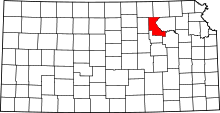 Location in the U.S. state of Kansas | |
 Kansas's location in the U.S. | |
| Founded | August 25, 1855 |
| Named for | Bennet C. Riley |
| Seat | Manhattan |
| Largest city | Manhattan |
| Area | |
| • Total | 622 sq mi (1,611 km2) |
| • Land | 610 sq mi (1,580 km2) |
| • Water | 12 sq mi (31 km2), 2.0% |
| Population (est.) | |
| • (2016) | 73,343 |
| • Density | 117/sq mi (45/km2) |
| Congressional district | 1st |
| Time zone | Central: UTC−6/−5 |
| Website | RileyCountyKS.gov |
Riley County (standard abbreviation: RL) is a county located in the U.S. state of Kansas. As of the 2010 census, the population was 71,115.[1] The largest city and county seat is Manhattan.[2]
Riley County is home to two of Kansas' largest employers: Fort Riley and Kansas State University.
History
Riley County, named for Mexican–American War general Bennet Riley, was on the western edge of the 33 original counties established by the Kansas Territorial Legislature in August 1855. For organizational purposes, Riley County initially had attached to it Geary County and all land west of Riley County, across Kansas Territory into present-day Colorado.[3]
The first Territorial Capital of Kansas Territory was located in the boundaries of Riley County, in the former town of Pawnee. The site now falls within the boundaries of Fort Riley, a U.S. Army post.[4]
Manhattan was selected as county seat in contentious fashion. In late 1857, an election was held to select the county seat, with Ogden prevailing. However, Manhattanites suspected election fraud, and were eventually able to prove that a number of votes were illegally cast.[3] Sheriff David A. Butterfield was forced to secure the county's books and records for Manhattan, and Manhattan was finally officially declared the county seat in 1858.[3][5]
On May 30, 1879, the "Irving, Kansas Tornado" began in Riley County. This tornado is estimated to have been an F4 on the Fujita scale, with a damage path 800 yards (700 m) wide and 100 miles (200 km) long. Eighteen people were killed and sixty were injured.[6]
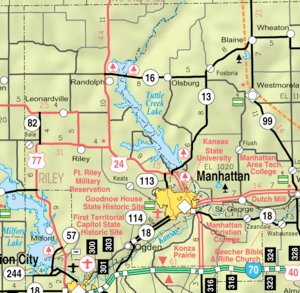
Geography
According to the U.S. Census Bureau, the county has a total area of 622 square miles (1,610 km2), of which 610 square miles (1,600 km2) is land and 12 square miles (31 km2) (2.0%) is water.[7]
The eastern border of the county follows the former course of the Big Blue River. The river was dammed in the 1960s and Tuttle Creek Lake was created as a result. The county falls within the Flint Hills region of the state.
Adjacent counties
- Marshall County (northeast)
- Pottawatomie County (east)
- Wabaunsee County (southeast)
- Geary County (south)
- Clay County (west)
- Washington County (northwest)
Demographics

| Historical population | |||
|---|---|---|---|
| Census | Pop. | %± | |
| 1860 | 1,224 | — | |
| 1870 | 5,105 | 317.1% | |
| 1880 | 10,430 | 104.3% | |
| 1890 | 13,183 | 26.4% | |
| 1900 | 13,828 | 4.9% | |
| 1910 | 15,783 | 14.1% | |
| 1920 | 20,650 | 30.8% | |
| 1930 | 19,882 | −3.7% | |
| 1940 | 20,617 | 3.7% | |
| 1950 | 33,405 | 62.0% | |
| 1960 | 41,914 | 25.5% | |
| 1970 | 56,788 | 35.5% | |
| 1980 | 63,505 | 11.8% | |
| 1990 | 67,139 | 5.7% | |
| 2000 | 62,843 | −6.4% | |
| 2010 | 71,115 | 13.2% | |
| Est. 2016 | 73,343 | [8] | 3.1% |
| U.S. Decennial Census[9] 1790-1960[10] 1900-1990[11] 1990-2000[12] 2010-2016[1] | |||
Riley County is part of the Manhattan, KS Metropolitan Statistical Area. Millennials (ages 15-34 years old) make up 53.6% of the population of Riley County, one of the highest rates in the United States.[13]
Millennials (ages 15-34 years old) make up 53.6% of the population of Riley County, one of the highest rates in the United States.[14]
2000 census
As of the census[15] of 2000, there were 62,843 people, 22,137 households, and 12,263 families residing in the county. The population density was 103 people per square mile (40/km²). There were 23,397 housing units at an average density of 38 per square mile (15/km²). The racial makeup of the county was 84.78% White, 6.88% Black or African American, 0.63% Native American, 3.22% Asian, 0.17% Pacific Islander, 1.89% from other races, and 2.43% from two or more races. 4.57% of the population were Hispanic or Latino of any race.
There were 22,137 households out of which 27.80% had children under the age of 18 living with them, 46.20% were married couples living together, 6.80% had a female householder with no husband present, and 44.60% were non-families. 27.50% of all households were made up of individuals and 6.10% had someone living alone who was 65 years of age or older. The average household size was 2.42 and the average family size was 2.99.
In the county, the population was spread out with 18.80% under the age of 18, 34.50% from 18 to 24, 25.90% from 25 to 44, 13.30% from 45 to 64, and 7.50% who were 65 years of age or older. The median age was 24 years. For every 100 females, there were 114.30 males. For every 100 females age 18 and over, there were 115.40 males.
The median income for a household in the county was $32,042, and the median income for a family was $46,489. Males had a median income of $26,856 versus $23,835 for females. The per capita income for the county was $16,349. About 8.50% of families and 20.60% of the population were below the poverty line, including 11.20% of those under age 18 and 6.70% of those age 65 or over.
Government
Presidential elections
| Year | Republican | Democratic | Third Parties |
|---|---|---|---|
| 2016 | 46.0% 10,107 | 42.5% 9,341 | 11.5% 2,526 |
| 2012 | 54.5% 11,507 | 42.5% 8,977 | 2.9% 617 |
| 2008 | 52.4% 12,111 | 45.4% 10,495 | 2.1% 494 |
| 2004 | 60.6% 12,672 | 37.8% 7,908 | 1.6% 331 |
| 2000 | 58.5% 10,672 | 33.9% 6,188 | 7.6% 1,393 |
| 1996 | 56.7% 11,113 | 34.4% 6,746 | 8.9% 1,748 |
| 1992 | 38.5% 8,394 | 36.4% 7,933 | 25.1% 5,470 |
| 1988 | 55.9% 9,507 | 42.8% 7,283 | 1.3% 217 |
| 1984 | 64.8% 11,308 | 34.2% 5,975 | 1.0% 175 |
| 1980 | 52.9% 8,904 | 31.1% 5,224 | 16.0% 2,690 |
| 1976 | 57.5% 9,518 | 39.5% 6,540 | 3.1% 510 |
| 1972 | 66.2% 11,120 | 31.7% 5,333 | 2.1% 356 |
| 1968 | 62.2% 8,296 | 31.9% 4,258 | 5.9% 791 |
| 1964 | 52.7% 6,396 | 46.1% 5,597 | 1.2% 144 |
| 1960 | 72.0% 9,068 | 27.6% 3,482 | 0.4% 50 |
| 1956 | 76.8% 9,385 | 22.8% 2,784 | 0.4% 44 |
| 1952 | 80.3% 9,799 | 19.3% 2,352 | 0.4% 50 |
| 1948 | 68.0% 9,227 | 29.9% 4,052 | 2.1% 288 |
| 1944 | 70.4% 6,511 | 28.8% 2,659 | 0.8% 74 |
| 1940 | 68.6% 7,420 | 30.4% 3,293 | 1.0% 105 |
| 1936 | 59.1% 6,077 | 39.9% 4,104 | 1.0% 99 |
| 1932 | 54.7% 5,337 | 42.0% 4,101 | 3.4% 327 |
| 1928 | 77.9% 6,592 | 21.2% 1,791 | 0.9% 78 |
| 1924 | 70.0% 5,455 | 21.1% 1,646 | 8.8% 689 |
| 1920 | 73.6% 4,875 | 24.3% 1,610 | 2.1% 141 |
| 1916 | 52.3% 3,320 | 41.6% 2,637 | 6.1% 386 |
| 1912 | 11.1% 425 | 30.7% 1,170 | 58.2% 2,220 |
| 1908 | 61.7% 2,276 | 35.0% 1,289 | 3.3% 123 |
| 1904 | 75.3% 2,251 | 17.5% 523 | 7.3% 217 |
| 1900 | 61.7% 2,119 | 37.2% 1,279 | 1.1% 37 |
| 1896 | 55.9% 1,890 | 42.7% 1,443 | 1.5% 50 |
| 1892 | 51.7% 1,574 | 48.3% 1,472 | |
| 1888 | 62.5% 1,856 | 26.0% 772 | 11.5% 342 |
Owing to its history of Yankee anti-slavery settlement in “Bleeding Kansas” days, Riley County became rock-ribbed Republican following Kansas statehood, except when over half of its voters supported Progressive Theodore Roosevelt in 1912. Being relatively resistant to the Democratic populism of William Jennings Bryan, Woodrow Wilson and Franklin D. Roosevelt, Riley County stands as the westernmost of thirty-eight US counties to have never voted Democratic for President since the Civil War. However, it is the only one whose status as “never Democratic” stands threatened: Donald Trump’s 46.0 percent is the third-worst by a Republican in history behind the 1912 and 1992 elections when major third party candidates influenced the result. Hilary Clinton’s losing margin of only 3.5 percent is the second-closest any Democrat has come to claiming the county behind her husband in that divided 1992 election.
Riley County is the only county in Kansas without an elected sheriff; the county police department handles all the Sheriff’s functions. [17]
Laws
Riley County was a prohibition, or "dry", county until the Kansas Constitution was amended in 1986 and voters approved the sale of alcoholic liquor by the individual drink with a 30 percent food sales requirement. The food sales requirement was removed with voter approval in 2004.[18]
Education
Colleges and universities
Unified school districts
Communities
Cities
- Leonardville
- Manhattan, also partly in Pottawatomie County
- Ogden
- Randolph
- Riley
Unincorporated communities
Ghost towns
- Lasita
- Walsburg
- May Day
These former places were flooded when Tuttle Creek Lake was created in the 1950s and 1960s. Randolph was also flooded, but moved a mile west of its original location.
- Cleburne
- Garrison Cross
- Stockdale
- Winkler[19]
Fort Riley
Located north of the junction of the Smoky Hill and Republican rivers in Geary County, Fort Riley Military Reservation covers 100,656 acres (407 km2) in Geary and Riley counties. The fort has a daytime population of nearly 25,000 and includes a census-designated place:
- Fort Riley (formerly "Fort Riley North")
Townships
Riley County is divided into fourteen townships. The city of Manhattan which is surrounded by Manhattan Township is considered governmentally independent and is excluded from the census figures for Manhattan Township or any other townships. In the following table, the population center is the largest city (or cities) included in that township's population total, if it is of a significant size.
Notable people
Among notable current and former residents of Riley County are former Governor John W. Carlin, General Glen Edgerton, millionaire miner Horace A. W. Tabor, NFL receiver Jordy Nelson.
See also
|
|
References
- 1 2 "State & County QuickFacts". United States Census Bureau. Retrieved June 16, 2015.
- ↑ "Find a County". National Association of Counties. Archived from the original on May 31, 2011. Retrieved 2011-06-07.
- 1 2 3 Olson, Kevin (2012). Frontier Manhattan. University Press of Kansas. pp. 54, 107–108. ISBN 978-0-7006-1832-3.
- ↑ Nichols, Roy Franklin (1931). Franklin Pierce: Young Hickory of the Granite Hills. Newtown, Connecticut: American Political Biography Press. p. 418. ISBN 0-945707-06-1.
- ↑ Riley County Official Website – History
- ↑ Joe Furr, "Historical Tornadoes"
- ↑ "US Gazetteer files: 2010, 2000, and 1990". United States Census Bureau. 2011-02-12. Retrieved 2011-04-23.
- ↑ "Population and Housing Unit Estimates". Retrieved June 9, 2017.
- ↑ "U.S. Decennial Census". United States Census Bureau. Archived from the original on May 12, 2015. Retrieved July 28, 2014.
- ↑ "Historical Census Browser". University of Virginia Library. Retrieved July 28, 2014.
- ↑ "Population of Counties by Decennial Census: 1900 to 1990". United States Census Bureau. Retrieved July 28, 2014.
- ↑ "Census 2000 PHC-T-4. Ranking Tables for Counties: 1990 and 2000" (PDF). United States Census Bureau. Retrieved July 28, 2014.
- ↑ http://overflow.solutions/demographic-data/what-states-and-counties-have-the-most-millennials/
- ↑ http://overflow.solutions/demographic-data/what-states-and-counties-have-the-most-millennials/
- ↑ "American FactFinder". United States Census Bureau. Archived from the original on September 11, 2013. Retrieved 2008-01-31.
- ↑ http://uselectionatlas.org/RESULTS
- ↑ https://www.sheriffs.org/sites/default/files/tb/Office_of_Sheriff_State-by-State_Election_Chart.pdf
- ↑ "Map of Wet and Dry Counties". Alcoholic Beverage Control, Kansas Department of Revenue. November 2006. Archived from the original on October 8, 2007. Retrieved 2007-12-28.
- ↑ Blackmar, Frank Wilson (1912). Kansas: A Cyclopedia of State History, Volume 2. Standard Publishing Company. p. 926.
Further reading
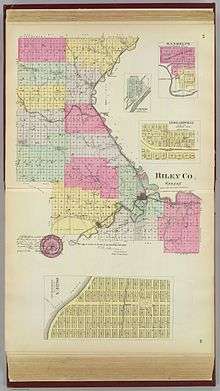
- Standard Atlas of Riley County, Kansas; Geo. A. Ogle & Co; 54 pages; 1909.
External links
| Wikimedia Commons has media related to Riley County, Kansas. |
- County
- Historical
- Maps
- Riley County Maps: Current, Historic, KDOT
- Riley County Maps: (historical Township and place maps)
- Kansas Highway Maps: Current, Historic, KDOT
- Kansas Railroad Maps: Current, 1996, 1915, KDOT and Kansas Historical Society
Places adjacent to Riley County, Kansas | ||||||||||
|---|---|---|---|---|---|---|---|---|---|---|
| ||||||||||
Municipalities and communities of Riley County, Kansas, United States | ||
|---|---|---|
| Cities | | |
| CDP | ||
| Unincorporated communities | ||
| Footnotes | ‡This populated place also has portions in an adjacent county or counties | |
