Greenwood County, Kansas
| Greenwood County, Kansas | |
|---|---|
| County | |
 | |
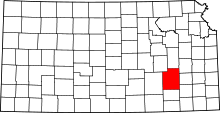 Location in the U.S. state of Kansas | |
 Kansas's location in the U.S. | |
| Founded | August 25, 1855 |
| Named for | Alfred B. Greenwood |
| Seat | Eureka |
| Largest city | Eureka |
| Area | |
| • Total | 1,153 sq mi (2,986 km2) |
| • Land | 1,143 sq mi (2,960 km2) |
| • Water | 9.3 sq mi (24 km2), 0.8% |
| Population (est.) | |
| • (2016) | 6,151 |
| • Density | 5.9/sq mi (2.3/km2) |
| Congressional district | 4th |
| Time zone | Central: UTC−6/−5 |
| Website | GreenwoodCounty.org |
Greenwood County (county code GW) is a county located in the southeast portion of the U.S. state of Kansas. As of the 2010 census, the county population was 6,689.[1] Its county seat and most populous city is Eureka.[2]
History
Early history
For many millennia, the Great Plains of North America was inhabited by nomadic Native Americans. From the 16th century to 18th century, the Kingdom of France claimed ownership of large parts of North America. In 1762, after the French and Indian War, France secretly ceded New France to Spain, per the Treaty of Fontainebleau.
19th century
In 1802, Spain returned most of the land to France, but keeping title to about 7,500 square miles. In 1803, most of the land for modern day Kansas was acquired by the United States from France as part of the 828,000 square mile Louisiana Purchase for 2.83 cents per acre.
In 1854, the Kansas Territory was organized, then in 1861 Kansas became the 34th U.S. state. In 1855, Greenwood County was established, and named for Alfred B. Greenwood,[3] a U.S. Congressman from Arkansas.
The first railroad in Greenwood County was built through that territory in 1879.[4]
Geography
According to the U.S. Census Bureau, the county has a total area of 1,153 square miles (2,990 km2), of which 1,143 square miles (2,960 km2) is land and 9.3 square miles (24 km2) (0.8%) is water.[5] It is the fifth-largest county in Kansas by area.
Adjacent counties
- Lyon County (north)
- Coffey County (northeast)
- Woodson County (east)
- Wilson County (southeast)
- Elk County (south)
- Butler County (west)
- Chase County (northwest)
Demographics
| Historical population | |||
|---|---|---|---|
| Census | Pop. | %± | |
| 1860 | 769 | — | |
| 1870 | 3,484 | 353.1% | |
| 1880 | 10,548 | 202.8% | |
| 1890 | 16,309 | 54.6% | |
| 1900 | 16,196 | −0.7% | |
| 1910 | 16,060 | −0.8% | |
| 1920 | 14,715 | −8.4% | |
| 1930 | 19,235 | 30.7% | |
| 1940 | 16,495 | −14.2% | |
| 1950 | 13,574 | −17.7% | |
| 1960 | 11,253 | −17.1% | |
| 1970 | 9,141 | −18.8% | |
| 1980 | 8,764 | −4.1% | |
| 1990 | 7,847 | −10.5% | |
| 2000 | 7,673 | −2.2% | |
| 2010 | 6,689 | −12.8% | |
| Est. 2016 | 6,151 | [6] | −8.0% |
| U.S. Decennial Census[7] 1790-1960[8] 1900-1990[9] 1990-2000[10] 2010-2016[1] | |||
As of the 2000 census,[11] there were 7,673 people, 3,234 households, and 2,153 families residing in the county. The population density was 7 people per square mile (3/km²). There were 4,273 housing units at an average density of 4 per square mile (1/km²). The racial makeup of the county was 96.53% White, 0.83% Native American, 0.14% Black or African American, 0.10% Asian, 0.81% from other races, and 1.58% from two or more races. Hispanic or Latino of any race were 1.72% of the population.
There were 3,234 households out of which 27.10% had children under the age of 18 living with them, 56.50% were married couples living together, 6.60% had a female householder with no husband present, and 33.40% were non-families. 30.30% of all households were made up of individuals and 16.80% had someone living alone who was 65 years of age or older. The average household size was 2.31 and the average family size was 2.86.
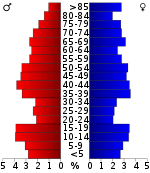
In the county, the population was spread out with 23.70% under the age of 18, 6.50% from 18 to 24, 23.20% from 25 to 44, 23.70% from 45 to 64, and 22.80% who were 65 years of age or older. The median age was 43 years. For every 100 females there were 95.50 males. For every 100 females age 18 and over, there were 91.50 males.
The median income for a household in the county was $30,169, and the median income for a family was $38,140. Males had a median income of $27,021 versus $19,356 for females. The per capita income for the county was $15,976. About 8.20% of families and 12.50% of the population were below the poverty line, including 16.20% of those under age 18 and 10.10% of those age 65 or over.
Government
Presidential elections
| Year | Republican | Democratic | Third Parties |
|---|---|---|---|
| 2016 | 76.1% 2,160 | 17.1% 485 | 6.9% 195 |
| 2012 | 74.9% 1,590 | 22.5% 478 | 2.6% 55 |
| 2008 | 71.0% 1,619 | 27.3% 622 | 1.7% 38 |
| 2004 | 70.4% 2,282 | 28.1% 911 | 1.6% 51 |
| 2000 | 67.2% 2,392 | 28.8% 1,027 | 4.0% 142 |
| 1996 | 53.2% 1,932 | 30.5% 1,108 | 16.4% 595 |
| 1992 | 36.6% 1,411 | 32.8% 1,262 | 30.6% 1,180 |
| 1988 | 59.7% 2,217 | 38.2% 1,421 | 2.1% 78 |
| 1984 | 70.5% 2,901 | 28.5% 1,173 | 1.1% 44 |
| 1980 | 64.6% 2,685 | 29.9% 1,241 | 5.5% 229 |
| 1976 | 56.0% 2,319 | 41.9% 1,737 | 2.1% 88 |
| 1972 | 74.5% 3,157 | 22.4% 951 | 3.1% 130 |
| 1968 | 66.0% 2,937 | 25.2% 1,122 | 8.8% 392 |
| 1964 | 56.6% 2,717 | 42.7% 2,048 | 0.8% 36 |
| 1960 | 67.5% 3,758 | 32.4% 1,804 | 0.2% 9 |
| 1956 | 70.0% 4,164 | 29.6% 1,763 | 0.4% 21 |
| 1952 | 73.7% 4,974 | 25.8% 1,743 | 0.5% 32 |
| 1948 | 57.3% 3,553 | 41.5% 2,574 | 1.2% 73 |
| 1944 | 64.0% 3,959 | 35.4% 2,187 | 0.7% 41 |
| 1940 | 60.3% 4,893 | 39.0% 3,160 | 0.7% 56 |
| 1936 | 49.7% 4,146 | 50.0% 4,176 | 0.3% 23 |
| 1932 | 46.4% 3,592 | 51.7% 4,002 | 2.0% 153 |
| 1928 | 78.5% 5,863 | 20.8% 1,554 | 0.7% 49 |
| 1924 | 64.0% 4,181 | 27.5% 1,794 | 8.5% 556 |
| 1920 | 68.3% 3,422 | 29.5% 1,478 | 2.1% 107 |
| 1916 | 48.3% 2,971 | 48.0% 2,956 | 3.7% 227 |
| 1912 | 25.8% 954 | 36.1% 1,334 | 38.1% 1,406[lower-alpha 1] |
| 1908 | 59.2% 2,370 | 38.6% 1,545 | 2.3% 91 |
| 1904 | 63.7% 2,458 | 31.4% 1,211 | 4.9% 190 |
| 1900 | 53.3% 2,204 | 46.3% 1,917 | 0.4% 16 |
| 1896 | 46.8% 1,835 | 52.6% 2,064 | 0.6% 23 |
| 1892 | 49.0% 1,734 | 51.0% 1,804 | |
| 1888 | 56.9% 2,242 | 28.2% 1,110 | 14.9% 589 |
Laws
Greenwood County was a prohibition, or "dry", county until the Kansas Constitution was amended in 1986 and voters approved the sale of alcoholic liquor by the individual drink with a 30% food sales requirement.[13]
Education
Unified school districts
- Madison-Virgil USD 386
- Eureka USD 389
- Hamilton USD 390
- West Elk USD 282 (serving Severy and extreme southern GW county)
Communities
Cities
Unincorporated communities
Ghost towns
- Blodgett
- Teeterville
- Thrall
- Utopia
Townships
Greenwood County is divided into fifteen townships. The city of Eureka is considered governmentally independent and is excluded from the census figures for the townships. In the following table, the population center is the largest city (or cities) included in that township's population total, if it is of a significant size.
| Township | FIPS | Population center |
Population | Population density /km² (/sq mi) |
Land area km² (sq mi) | Water area km² (sq mi) | Water % | Geographic coordinates |
|---|---|---|---|---|---|---|---|---|
| Bachelor | 03625 | 230 | 1 (4) | 155 (60) | 1 (0) | 0.70% | 37°49′57″N 96°12′21″W / 37.83250°N 96.20583°W | |
| Eureka | 21825 | 451 | 3 (8) | 149 (58) | 2 (1) | 1.50% | 37°50′41″N 96°17′49″W / 37.84472°N 96.29694°W | |
| Fall River | 22800 | 229 | 1 (4) | 154 (60) | 2 (1) | 1.13% | 37°42′36″N 96°12′4″W / 37.71000°N 96.20111°W | |
| Janesville | 35000 | 548 | 1 (4) | 371 (143) | 2 (1) | 0.62% | 37°59′4″N 96°11′29″W / 37.98444°N 96.19139°W | |
| Lane | 38425 | 167 | 1 (3) | 138 (53) | 1 (0) | 0.52% | 37°58′36″N 96°0′59″W / 37.97667°N 96.01639°W | |
| Madison | 44075 | 1,155 | 4 (9) | 320 (124) | 3 (1) | 0.85% | 38°7′32″N 96°12′11″W / 38.12556°N 96.20306°W | |
| Otter Creek | 53650 | 211 | 1 (2) | 290 (112) | 2 (1) | 0.55% | 37°40′20″N 96°24′0″W / 37.67222°N 96.40000°W | |
| Pleasant Grove | 56375 | 52 | 0 (1) | 150 (58) | 2 (1) | 1.57% | 37°47′21″N 96°1′41″W / 37.78917°N 96.02806°W | |
| Quincy | 58175 | 163 | 1 (3) | 155 (60) | 1 (0) | 0.38% | 37°51′8″N 96°2′59″W / 37.85222°N 96.04972°W | |
| Salem | 62650 | 35 | 0 (0) | 233 (90) | 2 (1) | 0.89% | 38°1′45″N 96°24′29″W / 38.02917°N 96.40806°W | |
| Salt Springs | 62875 | 463 | 3 (7) | 182 (70) | 10 (4) | 5.16% | 37°38′55″N 96°3′59″W / 37.64861°N 96.06639°W | |
| Shell Rock | 64600 | 173 | 1 (3) | 136 (53) | 1 (0) | 0.87% | 38°5′53″N 96°1′18″W / 38.09806°N 96.02167°W | |
| South Salem | 66925 | 127 | 1 (1) | 224 (87) | 3 (1) | 1.13% | 37°52′42″N 96°27′4″W / 37.87833°N 96.45111°W | |
| Spring Creek | 67425 | 154 | 1 (3) | 139 (54) | 1 (1) | 0.93% | 37°47′49″N 96°26′50″W / 37.79694°N 96.44722°W | |
| Twin Grove | 71825 | 601 | 4 (11) | 148 (57) | 1 (0) | 0.57% | 37°38′7″N 96°14′3″W / 37.63528°N 96.23417°W | |
| Sources: "Census 2000 U.S. Gazetteer Files". U.S. Census Bureau, Geography Division. Archived from the original on 2002-08-02. | ||||||||
See also
|
|
References
- 1 2 "State & County QuickFacts". United States Census Bureau. Archived from the original on July 11, 2011. Retrieved July 24, 2014.
- ↑ "Find a County". National Association of Counties. Archived from the original on 2011-05-31. Retrieved 2011-06-07.
- ↑ Gannett, Henry (1905). The Origin of Certain Place Names in the United States. Govt. Print. Off. p. 144.
- ↑ Blackmar, Frank Wilson (1912). Kansas: A Cyclopedia of State History, Embracing Events, Institutions, Industries, Counties, Cities, Towns, Prominent Persons, Etc. Standard Publishing Company. p. 795.
- ↑ "US Gazetteer files: 2010, 2000, and 1990". United States Census Bureau. 2011-02-12. Retrieved 2011-04-23.
- ↑ "Population and Housing Unit Estimates". Retrieved June 9, 2017.
- ↑ "U.S. Decennial Census". United States Census Bureau. Archived from the original on May 12, 2015. Retrieved July 24, 2014.
- ↑ "Historical Census Browser". University of Virginia Library. Retrieved July 24, 2014.
- ↑ "Population of Counties by Decennial Census: 1900 to 1990". United States Census Bureau. Retrieved July 24, 2014.
- ↑ "Census 2000 PHC-T-4. Ranking Tables for Counties: 1990 and 2000" (PDF). United States Census Bureau. Retrieved July 24, 2014.
- ↑ "American FactFinder". United States Census Bureau. Archived from the original on 2013-09-11. Retrieved 2008-01-31.
- ↑ http://uselectionatlas.org/RESULTS
- ↑ "Map of Wet and Dry Counties". Alcoholic Beverage Control, Kansas Department of Revenue. November 2006. Archived from the original on 2007-10-08. Retrieved 2007-12-28.
- Notes
- ↑ This total comprises 1,125 votes (30.45%) for Progressive Theodore Roosevelt and 281 votes (7.6%) for Socialist Eugene V. Debs.
Further reading
- Standard Atlas of Greenwood County, Kansas; Geo. A. Ogle & Co; 78 pages; 1922.
- Plat Book of Greenwood County, Kansas; North West Publishing Co; 58 pages; 1903.
- Handbook of Greenwood County, Kansas; C. S. Burch Publishing Co; 37 pages; 1880 to 1890.
External links
| Wikimedia Commons has media related to Greenwood County, Kansas. |
- County
- Maps
- Greenwood County Maps: Current, Historic, KDOT
- Kansas Highway Maps: Current, Historic, KDOT
- Kansas Railroad Maps: Current, 1996, 1915, KDOT and Kansas Historical Society
Places adjacent to Greenwood County, Kansas | ||||||||||
|---|---|---|---|---|---|---|---|---|---|---|
| ||||||||||
Municipalities and communities of Greenwood County, Kansas, United States | ||
|---|---|---|
| Cities | | |
| Unincorporated communities | ||
| Ghost towns | ||
| Townships | ||
