Comanche County, Kansas
| Comanche County, Kansas | |
|---|---|
| County | |
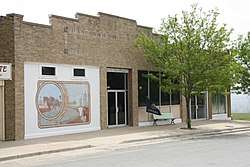 Comanche County Museum in Coldwater, Kansas. | |
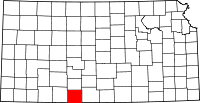 Location in the U.S. state of Kansas | |
 Kansas's location in the U.S. | |
| Coordinates: 37°11′N 99°16′W / 37.183°N 99.267°W | |
| Founded | February 26, 1867 |
| Named for | Comanche Native Americans |
| Seat | Coldwater |
| Largest city | Coldwater |
| Area | |
| • Total | 790 sq mi (2,046 km2) |
| • Land | 788 sq mi (2,041 km2) |
| • Water | 1.4 sq mi (4 km2), 0.2% |
| Population (est.) | |
| • (2016) | 1,862 |
| • Density | 2.4/sq mi (0.9/km2) |
| Area code(s) | 620 |
| Congressional district | 4th |
| Time zone | Central: UTC−6/−5 |
| Website | ComancheCounty.com |
Comanche County (county code CM) is a county located in the U.S. state of Kansas. As of the 2010 census, the county population was 1,891.[1] Its county seat and most populous city is Coldwater.[2] The county is named after the Comanche Native Americans.[3]
Geography
According to the U.S. Census Bureau, the county has a total area of 790 square miles (2,000 km2), of which 788 square miles (2,040 km2) is land and 1.4 square miles (3.6 km2) (0.2%) is water.[4]
Adjacent counties
- Kiowa County (north)
- Barber County (east)
- Woods County, Oklahoma (south)
- Harper County, Oklahoma (southwest)
- Clark County (west)
Demographics
| Historical population | |||
|---|---|---|---|
| Census | Pop. | %± | |
| 1880 | 372 | — | |
| 1890 | 2,549 | 585.2% | |
| 1900 | 1,619 | −36.5% | |
| 1910 | 3,281 | 102.7% | |
| 1920 | 5,302 | 61.6% | |
| 1930 | 5,238 | −1.2% | |
| 1940 | 4,412 | −15.8% | |
| 1950 | 3,888 | −11.9% | |
| 1960 | 3,271 | −15.9% | |
| 1970 | 2,702 | −17.4% | |
| 1980 | 2,554 | −5.5% | |
| 1990 | 2,313 | −9.4% | |
| 2000 | 1,967 | −15.0% | |
| 2010 | 1,891 | −3.9% | |
| Est. 2016 | 1,862 | [5] | −1.5% |
| U.S. Decennial Census[6] 1790–1960[7] 1900–1990[8] 1990–2000[9] 2010–2016[1] | |||
As of the 2000 census,[10] there were 1,967 people, 872 households, and 540 families residing in the county. The population density was 2 people per square mile (1/km2). There were 1,088 housing units at an average density of 1 per square mile (1/km2). The racial makeup of the county was 97.97% White, 0.05% Black or African American, 0.25% Native American, 0.05% Asian, 0.20% Pacific Islander, 0.61% from other races, and 0.86% from two or more races. Hispanic or Latino of any race were 1.78% of the population.
There were 872 households out of which 24.40% had children under the age of 18 living with them, 54.40% were married couples living together, 6.20% had a female householder with no husband present, and 38.00% were non-families. Of all households 35.90% were made up of individuals and 21.20% had someone living alone who was 65 years of age or older. The average household size was 2.18 and the average family size was 2.81.
In the county, the population was spread out with 22.10% under the age of 18, 4.50% from 18 to 24, 21.00% from 25 to 44, 26.50% from 45 to 64, and 25.80% who were 65 years of age or older. The median age was 47 years. For every 100 females there were 93.60 males. For every 100 females age 18 and over, there were 87.50 males.
The median income for a household in the county was $29,415, and the median income for a family was $36,790. Males had a median income of $24,844 versus $18,221 for females. The per capita income for the county was $17,037. About 8.50% of families and 10.20% of the population were below the poverty line, including 9.70% of those under age 18 and 7.70% of those age 65 or over.
Government
Presidential elections
| Year | Republican | Democratic | Third Parties |
|---|---|---|---|
| 2016 | 82.5% 715 | 11.8% 102 | 5.8% 50 |
| 2012 | 82.7% 767 | 15.4% 143 | 1.9% 18 |
| 2008 | 78.5% 765 | 19.9% 194 | 1.5% 15 |
| 2004 | 78.5% 770 | 20.4% 200 | 1.1% 11 |
| 2000 | 75.6% 760 | 21.0% 211 | 3.5% 35 |
| 1996 | 61.3% 691 | 26.4% 298 | 12.2% 138 |
| 1992 | 49.5% 636 | 25.3% 325 | 25.2% 324 |
| 1988 | 65.7% 738 | 33.4% 375 | 0.9% 10 |
| 1984 | 76.8% 993 | 22.0% 285 | 1.2% 15 |
| 1980 | 65.5% 877 | 29.3% 393 | 5.2% 70 |
| 1976 | 52.7% 719 | 46.2% 630 | 1.1% 15 |
| 1972 | 77.2% 1,052 | 20.6% 281 | 2.2% 30 |
| 1968 | 62.7% 906 | 31.2% 451 | 6.2% 89 |
| 1964 | 45.5% 694 | 53.7% 818 | 0.8% 12 |
| 1960 | 71.9% 1,187 | 27.9% 460 | 0.3% 5 |
| 1956 | 72.4% 1,238 | 27.0% 461 | 0.6% 11 |
| 1952 | 79.0% 1,443 | 20.5% 374 | 0.6% 10 |
| 1948 | 61.9% 1,077 | 37.4% 650 | 0.8% 13 |
| 1944 | 61.5% 1,048 | 37.7% 642 | 0.9% 15 |
| 1940 | 59.5% 1,322 | 39.6% 880 | 0.9% 20 |
| 1936 | 39.4% 932 | 60.4% 1,428 | 0.1% 3 |
| 1932 | 43.9% 945 | 54.6% 1,175 | 1.5% 32 |
| 1928 | 80.0% 1,554 | 19.8% 385 | 0.2% 4 |
| 1924 | 60.3% 1,049 | 24.8% 432 | 14.9% 260 |
| 1920 | 63.1% 1,121 | 34.4% 612 | 2.5% 45 |
| 1916 | 38.6% 732 | 50.7% 963 | 10.8% 204 |
| 1912 | 13.1% 148 | 33.3% 377 | 53.7% 609[lower-alpha 1] |
| 1908 | 59.7% 392 | 37.3% 245 | 3.0% 20 |
| 1904 | 63.4% 272 | 30.1% 129 | 6.5% 28 |
| 1900 | 54.9% 249 | 42.7% 194 | 2.4% 11 |
| 1896 | 44.9% 142 | 54.4% 172 | 0.6% 2 |
| 1892 | 45.5% 259 | 54.5% 310 | |
| 1888 | 50.7% 490 | 39.7% 384 | 9.6% 93 |
Laws
Although the Kansas Constitution was amended in 1986 to allow the sale of alcoholic liquor by the individual drink with the approval of voters, Comanche County has remained a prohibition, or "dry", county.[12]
Education
Unified school districts
Communities

Cities
Unincorporated community
Townships
Comanche County is divided into four townships. None of the cities within the county are considered "governmentally independent", and all figures for the townships include those of the cities. In the following table, the population center is the largest city (or cities) included in that township's population total, if it is of a significant size.
| Township | FIPS | Population center |
Population | Population density /km2 (/sq mi) |
Land area km2 (sq mi) | Water area km2 (sq mi) | Water % | Geographic coordinates |
|---|---|---|---|---|---|---|---|---|
| Avilla | 03525 | 58 | 0 (0) | 309 (119) | 0 (0) | 0.15% | 37°5′14″N 99°17′20″W / 37.08722°N 99.28889°W | |
| Coldwater | 14725 | Coldwater | 1,086 | 1 (3) | 1,099 (424) | 2 (1) | 0.17% | 37°16′6″N 99°18′5″W / 37.26833°N 99.30139°W |
| Powell | 57325 | 89 | 0 (1) | 186 (72) | 0 (0) | 0.03% | 37°20′36″N 99°8′37″W / 37.34333°N 99.14361°W | |
| Protection | 57875 | Protection | 734 | 2 (4) | 448 (173) | 1 (0) | 0.28% | 37°12′20″N 99°29′16″W / 37.20556°N 99.48778°W |
| Sources: "Census 2000 U.S. Gazetteer Files". U.S. Census Bureau, Geography Division. Archived from the original on 2002-08-02. | ||||||||
See also
|
|
References
- 1 2 "State & County QuickFacts". United States Census Bureau. Retrieved July 22, 2014.
- ↑ "Find a County". National Association of Counties. Archived from the original on 2011-05-31. Retrieved 2011-06-07.
- ↑ "Profile for Comanche County, Kansas". ePodunk. Retrieved 7 June 2014.
- ↑ "US Gazetteer files: 2010, 2000, and 1990". United States Census Bureau. 2011-02-12. Retrieved 2011-04-23.
- ↑ "Population and Housing Unit Estimates". Retrieved June 9, 2017.
- ↑ "U.S. Decennial Census". United States Census Bureau. Archived from the original on April 22, 2013. Retrieved July 22, 2014.
- ↑ "Historical Census Browser". University of Virginia Library. Retrieved July 22, 2014.
- ↑ "Population of Counties by Decennial Census: 1900 to 1990". United States Census Bureau. Retrieved July 22, 2014.
- ↑ "Census 2000 PHC-T-4. Ranking Tables for Counties: 1990 and 2000" (PDF). United States Census Bureau. Retrieved July 22, 2014.
- ↑ "American FactFinder". United States Census Bureau. Archived from the original on 2013-09-11. Retrieved 2008-01-31.
- ↑ http://uselectionatlas.org/RESULTS
- ↑ "Map of Wet and Dry Counties". Alcoholic Beverage Control, Kansas Department of Revenue. November 2004. Archived from the original on 2007-10-08. Retrieved 2007-01-21.
- Notes
- ↑ These comprised 537 votes for Progressive Theodore Roosevelt (who thus carried the county) and 72 for Socialist Eugene V. Debs.
Further reading
- Standard Atlas of Comanche County, Kansas; Geo. A. Ogle & Co; 42 pages; 1909.
External links
| Wikimedia Commons has media related to Comanche County, Kansas. |
- County
- Maps
- Comanche County Maps: Current, Historic, KDOT
- Kansas Highway Maps: Current, Historic, KDOT
- Kansas Railroad Maps: Current, 1996, 1915, KDOT and Kansas Historical Society
Places adjacent to Comanche County, Kansas | ||||||||||
|---|---|---|---|---|---|---|---|---|---|---|
| ||||||||||
Municipalities and communities of Comanche County, Kansas, United States | ||
|---|---|---|
| Cities | | |
| Unincorporated community | ||
| Townships | ||
