Pawnee County, Kansas
| Pawnee County, Kansas | |
|---|---|
| County | |
 Pawnee County Courthouse in Larned | |
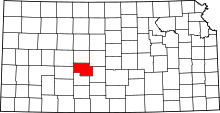 Location in the U.S. state of Kansas | |
 Kansas's location in the U.S. | |
| Founded | February 26, 1867 |
| Named for | Pawnee tribe |
| Seat | Larned |
| Largest city | Larned |
| Area | |
| • Total | 755 sq mi (1,955 km2) |
| • Land | 754 sq mi (1,953 km2) |
| • Water | 0.4 sq mi (1 km2), 0.05% |
| Population (est.) | |
| • (2016) | 6,743 |
| • Density | 9.2/sq mi (3.6/km2) |
| Congressional districts | 1st, 4th |
| Time zone | Central: UTC−6/−5 |
| Website | PawneeCountyKansas.com |
Pawnee County (standard abbreviation: PN) is a county located in the U.S. state of Kansas. As of the 2010 census, the county population was 6,973.[1] The largest city and county seat is Larned.[2]
Geography
According to the U.S. Census Bureau, the county has a total area of 755 square miles (1,960 km2), of which 754 square miles (1,950 km2) is land and 0.4 square miles (1.0 km2) (0.05%) is water.[3]
Adjacent counties
- Rush County (north)
- Barton County (northeast)
- Stafford County (east)
- Edwards County (south)
- Hodgeman County (west)
- Ness County (northwest)
National protected area
Demographics
| Historical population | |||
|---|---|---|---|
| Census | Pop. | %± | |
| 1870 | 179 | — | |
| 1880 | 5,396 | 2,914.5% | |
| 1890 | 5,204 | −3.6% | |
| 1900 | 5,084 | −2.3% | |
| 1910 | 8,859 | 74.3% | |
| 1920 | 9,323 | 5.2% | |
| 1930 | 10,510 | 12.7% | |
| 1940 | 10,300 | −2.0% | |
| 1950 | 11,041 | 7.2% | |
| 1960 | 10,254 | −7.1% | |
| 1970 | 8,484 | −17.3% | |
| 1980 | 8,065 | −4.9% | |
| 1990 | 7,555 | −6.3% | |
| 2000 | 7,233 | −4.3% | |
| 2010 | 6,973 | −3.6% | |
| Est. 2016 | 6,743 | [4] | −3.3% |
| U.S. Decennial Census[5] 1790-1960[6] 1900-1990[7] 1990-2000[8] 2010-2016[1] | |||
As of the census[9] of 2000, there were 7,233 people, 2,739 households, and 1,785 families residing in the county. The population density was 10 people per square mile (4/km²). There were 3,114 housing units at an average density of 4 per square mile (2/km²). The racial makeup of the county was 90.96% White, 5.00% Black or African American, 0.95% Native American, 0.57% Asian, 1.22% from other races, and 1.30% from two or more races. 4.16% of the population were Hispanic or Latino of any race.
There were 2,739 households out of which 29.20% had children under the age of 18 living with them, 54.80% were married couples living together, 7.30% had a female householder with no husband present, and 34.80% were non-families. 32.20% of all households were made up of individuals and 15.60% had someone living alone who was 65 years of age or older. The average household size was 2.31 and the average family size was 2.91.
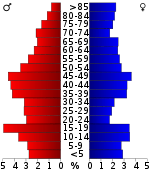
In the county, the population was spread out with 24.20% under the age of 18, 7.30% from 18 to 24, 25.40% from 25 to 44, 24.60% from 45 to 64, and 18.50% who were 65 years of age or older. The median age was 40 years. For every 100 females there were 112.00 males. For every 100 females age 18 and over, there were 112.70 males.
The median income for a household in the county was $35,175, and the median income for a family was $45,634. Males had a median income of $26,751 versus $20,931 for females. The per capita income for the county was $17,584. About 5.40% of families and 11.80% of the population were below the poverty line, including 9.00% of those under age 18 and 9.90% of those age 65 or over.
Government
Presidential elections
| Year | Republican | Democratic | Third Parties |
|---|---|---|---|
| 2016 | 71.6% 1,904 | 21.8% 579 | 6.7% 178 |
| 2012 | 70.4% 1,836 | 27.5% 718 | 2.1% 54 |
| 2008 | 67.6% 1,946 | 30.6% 882 | 1.8% 51 |
| 2004 | 72.7% 2,172 | 25.9% 773 | 1.4% 43 |
| 2000 | 62.9% 1,850 | 32.9% 968 | 4.2% 122 |
| 1996 | 61.1% 1,927 | 29.6% 932 | 9.4% 295 |
| 1992 | 37.9% 1,357 | 31.2% 1,118 | 31.0% 1,110 |
| 1988 | 54.1% 1,825 | 43.7% 1,474 | 2.2% 74 |
| 1984 | 68.9% 2,570 | 29.3% 1,092 | 1.8% 68 |
| 1980 | 58.8% 2,170 | 32.1% 1,184 | 9.1% 337 |
| 1976 | 45.1% 1,692 | 52.2% 1,959 | 2.7% 100 |
| 1972 | 65.8% 2,370 | 30.8% 1,110 | 3.3% 120 |
| 1968 | 54.2% 2,037 | 37.7% 1,416 | 8.1% 306 |
| 1964 | 36.0% 1,468 | 63.3% 2,577 | 0.7% 29 |
| 1960 | 58.3% 2,618 | 41.3% 1,853 | 0.4% 18 |
| 1956 | 63.7% 2,788 | 35.8% 1,567 | 0.5% 20 |
| 1952 | 71.1% 3,431 | 27.8% 1,340 | 1.1% 53 |
| 1948 | 52.4% 2,221 | 45.9% 1,945 | 1.6% 69 |
| 1944 | 54.1% 2,057 | 45.4% 1,727 | 0.6% 22 |
| 1940 | 50.8% 2,329 | 48.3% 2,216 | 0.9% 42 |
| 1936 | 38.3% 1,753 | 61.5% 2,814 | 0.2% 9 |
| 1932 | 42.5% 1,889 | 55.2% 2,451 | 2.3% 103 |
| 1928 | 75.2% 2,829 | 24.4% 918 | 0.4% 16 |
| 1924 | 62.5% 2,407 | 28.9% 1,111 | 8.6% 331 |
| 1920 | 64.0% 2,128 | 34.2% 1,138 | 1.8% 60 |
| 1916 | 38.7% 1,499 | 55.1% 2,131 | 6.2% 241 |
| 1912 | 16.3% 366 | 46.6% 1,050 | 37.1% 836 |
| 1908 | 48.4% 1,000 | 46.5% 961 | 5.0% 104 |
| 1904 | 60.8% 957 | 31.4% 494 | 7.8% 123 |
| 1900 | 48.0% 684 | 51.0% 727 | 1.0% 14 |
| 1896 | 43.3% 499 | 55.1% 635 | 1.7% 19 |
| 1892 | 47.9% 670 | 52.1% 730 | |
| 1888 | 61.9% 895 | 21.0% 303 | 17.1% 247 |
Laws
Following amendment to the Kansas Constitution in 1986, Pawnee County remained a prohibition, or "dry", county until 1992, when voters approved the sale of alcoholic liquor by the individual drink with a 30 percent food sales requirement.[11]
Education
Unified school districts
Communities

Cities
Unincorporated communities
Townships
Pawnee County is divided into twenty-one townships. The city of Larned is considered governmentally independent and is excluded from the census figures for the townships. In the following table, the population center is the largest city (or cities) included in that township's population total, if it is of a significant size.
See also
|
|
References
- 1 2 "State & County QuickFacts". United States Census Bureau. Archived from the original on July 16, 2011. Retrieved July 28, 2014.
- ↑ "Find a County". National Association of Counties. Archived from the original on May 31, 2011. Retrieved 2011-06-07.
- ↑ "US Gazetteer files: 2010, 2000, and 1990". United States Census Bureau. 2011-02-12. Retrieved 2011-04-23.
- ↑ "Population and Housing Unit Estimates". Retrieved June 9, 2017.
- ↑ "U.S. Decennial Census". United States Census Bureau. Archived from the original on May 12, 2015. Retrieved July 28, 2014.
- ↑ "Historical Census Browser". University of Virginia Library. Retrieved July 28, 2014.
- ↑ "Population of Counties by Decennial Census: 1900 to 1990". United States Census Bureau. Retrieved July 28, 2014.
- ↑ "Census 2000 PHC-T-4. Ranking Tables for Counties: 1990 and 2000" (PDF). United States Census Bureau. Retrieved July 28, 2014.
- ↑ "American FactFinder". United States Census Bureau. Retrieved 2008-01-31.
- ↑ http://uselectionatlas.org/RESULTS
- ↑ "Map of Wet and Dry Counties". Alcoholic Beverage Control, Kansas Department of Revenue. November 2006. Archived from the original on 2007-10-08. Retrieved 2007-12-26.
Further reading
- County
- Atlas and Plat Book of Pawnee County, Kansas; Kenyon Co; 37 pages; 1916.
- Plat Book of Pawnee County, Kansas; North West Publishing Co; 36 pages; 1902.
- Trails
- The Story of the Marking of the Santa Fe Trail by the Daughters of the American Revolution in Kansas and the State of Kansas; Almira Cordry; Crane Co; 164 pages; 1915. (Download 4MB PDF eBook)
- The National Old Trails Road To Southern California, Part 1 (LA to KC); Automobile Club Of Southern California; 64 pages; 1916. (Download 6.8MB PDF eBook)
External links
| Wikimedia Commons has media related to Pawnee County, Kansas. |
- County
- Maps
- Pawnee County Maps: Current, Historic, KDOT
- Kansas Highway Maps: Current, Historic, KDOT
- Kansas Railroad Maps: Current, 1996, 1915, KDOT and Kansas Historical Society
Places adjacent to Pawnee County, Kansas | ||||||||||
|---|---|---|---|---|---|---|---|---|---|---|
| ||||||||||
Municipalities and communities of Pawnee County, Kansas, United States | ||
|---|---|---|
| Cities | | |
| Unincorporated communities | ||
