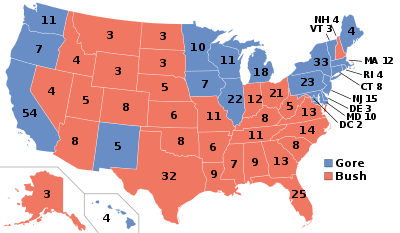
The 2000 United States presidential election in Kansas took place on November 7, 2000, and was part of the 2000 United States presidential election. Voters chose 6 representatives, or electors to the Electoral College, who voted for president and vice president.
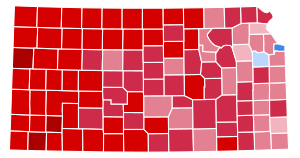
Kansas was won by Governor George W. Bush. He won all of the congressional districts and counties in the state, except for Douglas County and Wyandotte County. Gore won Douglas with just 45.8% of the vote. Nader also had his best performance by far in Douglas, where he got over 10% of the vote. Bush performed very well in the first district, which is the western and most rural part of the state.
Results
By congressional district
Bush won all four congressional districts.[1]
By county
| County |
Gore% |
Gore# |
Bush% |
Bush# |
Others% |
Others# |
Total |
| Allen County | 36.98% | 2,132 | 58.60% | 3,379 | 4.42% | 255 | 5,766 |
| Anderson County | 38.15% | 1,327 | 57.04% | 1,984 | 4.80% | 167 | 3,478 |
| Atchison County | 45.96% | 3,171 | 48.96% | 3,378 | 5.09% | 351 | 6,900 |
| Barber County | 25.50% | 637 | 70.26% | 1,755 | 4.24% | 106 | 2,498 |
| Barton County | 29.56% | 3,238 | 66.65% | 7,302 | 3.79% | 415 | 10,955 |
| Bourbon County | 35.05% | 2,211 | 61.07% | 3,852 | 3.88% | 245 | 6,308 |
| Brown County | 32.23% | 1,512 | 63.63% | 2,985 | 4.14% | 194 | 4,691 |
| Butler County | 32.16% | 6,755 | 63.69% | 13,377 | 4.14% | 870 | 21,002 |
| Chase County | 29.69% | 391 | 64.39% | 848 | 5.92% | 78 | 1,317 |
| Chautauqua County | 23.56% | 443 | 71.65% | 1,347 | 4.79% | 90 | 1,880 |
| Cherokee County | 41.43% | 3,783 | 54.92% | 5,014 | 3.65% | 333 | 9,130 |
| Cheyenne County | 20.27% | 350 | 75.97% | 1,312 | 3.76% | 65 | 1,727 |
| Clark County | 23.16% | 292 | 73.43% | 926 | 3.41% | 43 | 1,261 |
| Clay County | 23.26% | 951 | 73.34% | 2,998 | 3.40% | 139 | 4,088 |
| Cloud County | 29.18% | 1,314 | 64.80% | 2,918 | 6.02% | 271 | 4,503 |
| Coffey County | 29.60% | 1,196 | 66.83% | 2,700 | 3.56% | 144 | 4,040 |
| Comanche County | 20.97% | 211 | 75.55% | 760 | 3.48% | 35 | 1,006 |
| Cowley County | 38.95% | 5,535 | 56.86% | 8,080 | 4.19% | 595 | 14,210 |
| Crawford County | 47.07% | 7,076 | 47.63% | 7,160 | 5.31% | 798 | 15,034 |
| Decatur County | 24.10% | 424 | 71.35% | 1,255 | 4.55% | 80 | 1,759 |
| Dickinson County | 29.82% | 2,413 | 64.79% | 5,243 | 5.39% | 436 | 8,092 |
| Doniphan County | 31.08% | 1,134 | 64.40% | 2,350 | 4.52% | 165 | 3,649 |
| Douglas County | 45.81% | 18,249 | 42.83% | 17,062 | 11.36% | 4,527 | 39,838 |
| Edwards County | 28.60% | 447 | 67.95% | 1,062 | 3.45% | 54 | 1,563 |
| Elk County | 25.94% | 402 | 69.68% | 1,080 | 4.39% | 68 | 1,550 |
| Ellis County | 35.18% | 3,926 | 58.39% | 6,516 | 6.43% | 718 | 11,160 |
| Ellsworth County | 29.06% | 825 | 64.99% | 1,845 | 5.95% | 169 | 2,839 |
| Finney County | 26.57% | 2,431 | 70.40% | 6,442 | 3.03% | 277 | 9,150 |
| Ford County | 28.78% | 2,566 | 67.85% | 6,050 | 3.38% | 301 | 8,917 |
| Franklin County | 34.39% | 3,321 | 61.35% | 5,925 | 4.27% | 412 | 9,658 |
| Geary County | 38.74% | 2,660 | 57.92% | 3,977 | 3.34% | 229 | 6,866 |
| Gove County | 19.80% | 296 | 75.05% | 1,122 | 5.15% | 77 | 1,495 |
| Graham County | 23.47% | 346 | 71.78% | 1,058 | 4.75% | 70 | 1,474 |
| Grant County | 23.91% | 683 | 74.44% | 2,126 | 1.65% | 47 | 2,856 |
| Gray County | 22.31% | 482 | 75.51% | 1,631 | 2.18% | 47 | 2,160 |
| Greeley County | 17.81% | 143 | 78.21% | 628 | 3.99% | 32 | 803 |
| Greenwood County | 28.84% | 1,027 | 67.17% | 2,392 | 3.99% | 142 | 3,561 |
| Hamilton County | 22.15% | 264 | 75.59% | 901 | 2.27% | 27 | 1,192 |
| Harper County | 28.45% | 869 | 67.95% | 2,076 | 3.60% | 110 | 3,055 |
| Harvey County | 33.55% | 4,591 | 60.44% | 8,271 | 6.01% | 822 | 13,684 |
| Haskell County | 16.27% | 263 | 81.87% | 1,323 | 1.86% | 30 | 1,616 |
| Hodgeman County | 19.94% | 217 | 76.75% | 835 | 3.31% | 36 | 1,088 |
| Jackson County | 37.90% | 1,990 | 57.16% | 3,001 | 4.93% | 259 | 5,250 |
| Jefferson County | 38.09% | 3,000 | 56.15% | 4,423 | 5.76% | 454 | 7,877 |
| Jewell County | 20.25% | 380 | 74.59% | 1,400 | 5.17% | 97 | 1,877 |
| Johnson County | 36.37% | 79,118 | 59.74% | 129,965 | 3.89% | 8,453 | 217,536 |
| Kearny County | 22.30% | 320 | 75.54% | 1,084 | 2.16% | 31 | 1,435 |
| Kingman County | 26.02% | 991 | 70.17% | 2,672 | 3.81% | 145 | 3,808 |
| Kiowa County | 18.28% | 294 | 78.48% | 1,262 | 3.23% | 52 | 1,608 |
| Labette County | 43.86% | 3,745 | 52.41% | 4,475 | 3.72% | 318 | 8,538 |
| Lane County | 22.24% | 252 | 74.67% | 846 | 3.09% | 35 | 1,133 |
| Leavenworth County | 41.82% | 9,733 | 54.07% | 12,583 | 4.10% | 955 | 23,271 |
| Lincoln County | 24.81% | 469 | 68.52% | 1,295 | 6.67% | 126 | 1,890 |
| Linn County | 37.26% | 1,587 | 59.00% | 2,513 | 3.73% | 159 | 4,259 |
| Logan County | 16.54% | 231 | 77.88% | 1,088 | 5.58% | 78 | 1,397 |
| Lyon County | 41.67% | 5,190 | 53.41% | 6,652 | 4.92% | 613 | 12,455 |
| Marion County | 24.99% | 1,475 | 70.40% | 4,156 | 4.61% | 272 | 5,903 |
| Marshall County | 35.80% | 1,831 | 59.94% | 3,066 | 4.26% | 218 | 5,115 |
| McPherson County | 26.26% | 3,272 | 68.22% | 8,501 | 5.52% | 688 | 12,461 |
| Meade County | 19.48% | 400 | 78.13% | 1,604 | 2.39% | 49 | 2,053 |
| Miami County | 39.23% | 4,554 | 56.96% | 6,611 | 3.81% | 442 | 11,607 |
| Mitchell County | 22.99% | 751 | 71.95% | 2,350 | 5.05% | 165 | 3,266 |
| Montgomery County | 34.70% | 4,770 | 61.81% | 8,496 | 3.48% | 479 | 13,745 |
| Morris County | 33.40% | 882 | 60.55% | 1,599 | 6.06% | 160 | 2,641 |
| Morton County | 20.62% | 321 | 77.26% | 1,203 | 2.12% | 33 | 1,557 |
| Nemaha County | 28.24% | 1,494 | 67.64% | 3,578 | 4.12% | 218 | 5,290 |
| Neosho County | 37.58% | 2,588 | 58.29% | 4,014 | 4.12% | 284 | 6,886 |
| Ness County | 20.42% | 383 | 75.69% | 1,420 | 3.89% | 73 | 1,876 |
| Norton County | 24.40% | 598 | 71.15% | 1,744 | 4.45% | 109 | 2,451 |
| Osage County | 38.26% | 2,530 | 57.01% | 3,770 | 4.73% | 313 | 6,613 |
| Osborne County | 23.84% | 484 | 70.54% | 1,432 | 5.62% | 114 | 2,030 |
| Ottawa County | 22.61% | 631 | 70.83% | 1,977 | 6.56% | 183 | 2,791 |
| Pawnee County | 32.93% | 968 | 62.93% | 1,850 | 4.15% | 122 | 2,940 |
| Phillips County | 21.88% | 611 | 73.67% | 2,057 | 4.44% | 124 | 2,792 |
| Pottawatomie County | 26.35% | 2,037 | 64.48% | 4,985 | 9.17% | 709 | 7,731 |
| Pratt County | 29.76% | 1,314 | 65.33% | 2,885 | 4.91% | 217 | 4,416 |
| Rawlins County | 17.59% | 306 | 77.53% | 1,349 | 4.89% | 85 | 1,740 |
| Reno County | 35.49% | 9,025 | 59.69% | 15,179 | 4.82% | 1,226 | 25,430 |
| Republic County | 20.23% | 604 | 75.01% | 2,239 | 4.76% | 142 | 2,985 |
| Rice County | 31.46% | 1,422 | 64.23% | 2,903 | 4.31% | 195 | 4,520 |
| Riley County | 33.90% | 6,188 | 58.47% | 10,672 | 7.63% | 1,393 | 18,253 |
| Rooks County | 21.51% | 597 | 72.65% | 2,016 | 5.84% | 162 | 2,775 |
| Rush County | 27.24% | 505 | 66.61% | 1,235 | 6.15% | 114 | 1,854 |
| Russell County | 25.45% | 886 | 69.90% | 2,434 | 4.65% | 162 | 3,482 |
| Saline County | 34.78% | 7,487 | 57.66% | 12,412 | 7.56% | 1,628 | 21,527 |
| Scott County | 18.15% | 418 | 78.64% | 1,811 | 3.21% | 74 | 2,303 |
| Sedgwick County | 38.28% | 62,561 | 57.35% | 93,724 | 4.36% | 7,132 | 163,417 |
| Seward County | 22.10% | 1,126 | 75.92% | 3,869 | 1.98% | 101 | 5,096 |
| Shawnee County | 46.82% | 34,818 | 48.26% | 35,894 | 4.92% | 3,661 | 74,373 |
| Sheridan County | 18.87% | 281 | 76.02% | 1,132 | 5.10% | 76 | 1,489 |
| Sherman County | 25.39% | 681 | 70.62% | 1,894 | 3.99% | 107 | 2,682 |
| Smith County | 24.45% | 534 | 70.24% | 1,534 | 5.31% | 116 | 2,184 |
| Stafford County | 25.77% | 567 | 70.27% | 1,546 | 3.95% | 87 | 2,200 |
| Stanton County | 20.89% | 215 | 76.29% | 785 | 2.82% | 29 | 1,029 |
| Stevens County | 16.34% | 345 | 81.19% | 1,714 | 2.46% | 52 | 2,111 |
| Sumner County | 34.69% | 3,549 | 60.36% | 6,176 | 4.96% | 507 | 10,232 |
| Thomas County | 21.35% | 807 | 74.66% | 2,822 | 3.99% | 151 | 3,780 |
| Trego County | 28.09% | 516 | 66.41% | 1,220 | 5.50% | 101 | 1,837 |
| Wabaunsee County | 29.97% | 1,025 | 63.80% | 2,182 | 6.23% | 213 | 3,420 |
| Wallace County | 11.96% | 103 | 85.60% | 737 | 2.44% | 21 | 861 |
| Washington County | 21.03% | 687 | 74.87% | 2,446 | 4.10% | 134 | 3,267 |
| Wichita County | 18.99% | 207 | 78.81% | 859 | 2.20% | 24 | 1,090 |
| Wilson County | 28.96% | 1,186 | 67.11% | 2,748 | 3.93% | 161 | 4,095 |
| Woodson County | 32.66% | 521 | 61.07% | 974 | 6.27% | 100 | 1,595 |
| Wyandotte County | 67.14% | 32,411 | 29.05% | 14,024 | 3.81% | 1,837 | 48,272 |
Electors
Technically the voters of Kansas cast their ballots for electors: representatives to the Electoral College. Kansas is allocated 6 electors because it has 4 congressional districts and 2 senators. All candidates who appear on the ballot or qualify to receive write-in votes must submit a list of 6 electors, who pledge to vote for their candidate and his or her running mate. Whoever wins the majority of votes in the state is awarded all 6 electoral votes. Their chosen electors then vote for president and vice president. Although electors are pledged to their candidate and running mate, they are not obligated to vote for them. An elector who votes for someone other than his or her candidate is known as a faithless elector.
The electors of each state and the District of Columbia met on December 18, 2000[2] to cast their votes for president and vice president. The Electoral College itself never meets as one body. Instead the electors from each state and the District of Columbia met in their respective capitols.
The following were the members of the Electoral College from the state. All were pledged to and voted for George W. Bush and Dick Cheney:[3]
- Shari Caywood
- Gene Eastin
- Richard Eckert
- Susan Estes
- Mark Heitz
- Charles Hostetler
References
|
|---|
| Candidates | | |
|---|
General
articles | |
|---|
Local
results | |
|---|
Other 2000
elections | |
|---|