Henry County, Kentucky
| Henry County, Kentucky | |
|---|---|
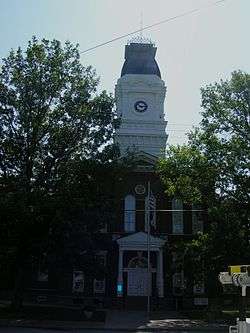 Henry County courthouse in New Castle | |
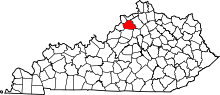 Location in the U.S. state of Kentucky | |
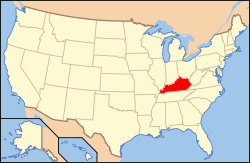 Kentucky's location in the U.S. | |
| Founded | 1798 |
| Named for | Patrick Henry |
| Seat | New Castle |
| Largest city | Eminence |
| Area | |
| • Total | 291 sq mi (754 km2) |
| • Land | 286 sq mi (741 km2) |
| • Water | 4.8 sq mi (12 km2), 1.7% |
| Population | |
| • (2010) | 15,416 |
| • Density | 54/sq mi (21/km2) |
| Congressional district | 4th |
| Time zone | Eastern: UTC−5/−4 |
| Website |
www |
Henry County is a county located in the U.S. state of Kentucky bordering the Kentucky River. As of the 2010 census, the population was 15,416.[1] Its county seat is New Castle, but its largest city is Eminence.[2] The county was founded in 1798 from portions of Shelby County.[3] It was named for the statesman and governor of Virginia Patrick Henry.[4][5]
Henry County is included in the Louisville/Jefferson County, KY-IN Metropolitan Statistical Area. Since the 1990s, it has become an increasingly important exurb, especially as land prices have become higher in neighboring Oldham County.
With regard to the sale of alcohol, it is classified as a wet county.[6]
Geography
According to the U.S. Census Bureau, the county has a total area of 291 square miles (750 km2), of which 286 square miles (740 km2) is land and 4.8 square miles (12 km2) (1.7%) is water.[7]
Adjacent counties
- Carroll County (north)
- Owen County (east)
- Franklin County (southeast)
- Shelby County (south)
- Oldham County (west)
- Trimble County (northwest)
Demographics
| Historical population | |||
|---|---|---|---|
| Census | Pop. | %± | |
| 1800 | 3,258 | — | |
| 1810 | 6,777 | 108.0% | |
| 1820 | 10,816 | 59.6% | |
| 1830 | 11,387 | 5.3% | |
| 1840 | 10,015 | −12.0% | |
| 1850 | 11,442 | 14.2% | |
| 1860 | 11,949 | 4.4% | |
| 1870 | 11,066 | −7.4% | |
| 1880 | 14,492 | 31.0% | |
| 1890 | 14,164 | −2.3% | |
| 1900 | 14,620 | 3.2% | |
| 1910 | 13,716 | −6.2% | |
| 1920 | 13,411 | −2.2% | |
| 1930 | 12,564 | −6.3% | |
| 1940 | 12,220 | −2.7% | |
| 1950 | 11,394 | −6.8% | |
| 1960 | 10,987 | −3.6% | |
| 1970 | 10,910 | −0.7% | |
| 1980 | 12,740 | 16.8% | |
| 1990 | 12,823 | 0.7% | |
| 2000 | 15,060 | 17.4% | |
| 2010 | 15,416 | 2.4% | |
| Est. 2016 | 15,818 | [8] | 2.6% |
| U.S. Decennial Census[9] 1790-1960[10] 1900-1990[11] 1990-2000[12] 2010-2013[1] | |||
As of the census[13] of 2000, there were 15,060 people, 5,844 households, and 4,330 families residing in the county. The population density was 52 per square mile (20/km2). There were 6,381 housing units at an average density of 22 per square mile (8.5/km2). The racial makeup of the county was 93.97% White, 3.30% Black or African American, 0.24% Native American, 0.35% Asian, 0.02% Pacific Islander, 1.26% from other races, and 0.86% from two or more races. 2.25% of the population were Hispanic or Latino of any race.
There were 5,844 households out of which 33.80% had children under the age of 18 living with them, 58.70% were married couples living together, 10.40% had a female householder with no husband present, and 25.90% were non-families. 22.00% of all households were made up of individuals and 9.90% had someone living alone who was 65 years of age or older. The average household size was 2.57 and the average family size was 2.97.
The age distribution was 25.40% under the age of 18, 7.90% from 18 to 24, 29.70% from 25 to 44, 24.70% from 45 to 64, and 12.30% who were 65 years of age or older. The median age was 37 years. For every 100 females, there were 99.30 males. For every 100 females age 18 and over, there were 95.90 males.
The median income for a household in the county was $37,263, and the median income for a family was $45,009. Males had a median income of $31,478 versus $21,982 for females. The per capita income for the county was $17,846. About 10.40% of families and 13.70% of the population were below the poverty line, including 15.50% of those under age 18 and 19.90% of those age 65 or over.
Communities
- Bethlehem
- Campbellsburg
- Defoe
- Eminence
- Franklinton
- Lockport
- New Castle (county seat)
- Pendleton
- Pleasureville
- Port Royal
- Smithfield
- Sulphur
- Turners Station
Notable residents
- Wendell Berry, writer
- Reuben T. Durrett, lawyer, author, and Kentucky historian
- William J. Graves, U.S. congressman
- Chelsey Croucher, fashion and portrait photographer
Politics
| Year | Republican | Democratic | Third parties |
|---|---|---|---|
| 2016 | 69.2% 4,944 | 25.6% 1,828 | 5.3% 377 |
| 2012 | 59.8% 3,940 | 38.4% 2,530 | 1.8% 120 |
| 2008 | 59.0% 4,081 | 39.4% 2,725 | 1.6% 113 |
| 2004 | 63.0% 4,094 | 36.4% 2,366 | 0.6% 39 |
| 2000 | 59.3% 3,244 | 38.7% 2,117 | 2.1% 112 |
| 1996 | 42.1% 2,110 | 46.4% 2,324 | 11.5% 576 |
| 1992 | 31.4% 1,640 | 54.4% 2,838 | 14.2% 741 |
| 1988 | 47.0% 2,286 | 52.3% 2,544 | 0.7% 36 |
| 1984 | 54.8% 2,802 | 44.6% 2,279 | 0.6% 29 |
| 1980 | 35.8% 1,723 | 62.4% 2,999 | 1.8% 88 |
| 1976 | 28.3% 1,192 | 70.7% 2,985 | 1.0% 43 |
| 1972 | 52.5% 1,919 | 46.2% 1,688 | 1.3% 49 |
| 1968 | 32.0% 1,271 | 49.9% 1,978 | 18.1% 718 |
| 1964 | 19.2% 838 | 80.7% 3,521 | 0.1% 4 |
| 1960 | 36.6% 1,714 | 63.4% 2,969 | 0.0% 0 |
| 1956 | 34.5% 1,670 | 65.3% 3,157 | 0.2% 11 |
| 1952 | 31.3% 1,584 | 68.5% 3,468 | 0.2% 10 |
| 1948 | 25.4% 1,193 | 72.5% 3,398 | 2.1% 98 |
| 1944 | 29.6% 1,497 | 70.1% 3,548 | 0.4% 18 |
| 1940 | 27.1% 1,445 | 72.5% 3,862 | 0.4% 22 |
| 1936 | 29.9% 1,516 | 70.0% 3,545 | 0.1% 4 |
| 1932 | 27.4% 1,643 | 71.9% 4,303 | 0.7% 41 |
| 1928 | 44.3% 2,334 | 55.6% 2,929 | 0.1% 7 |
| 1924 | 33.9% 1,918 | 65.4% 3,706 | 0.7% 40 |
| 1920 | 32.0% 2,208 | 67.3% 4,640 | 0.7% 49 |
| 1916 | 33.2% 1,302 | 66.1% 2,595 | 0.7% 28 |
| 1912 | 22.5% 805 | 63.6% 2,274 | 13.9% 496 |
See also
References
- 1 2 "State & County QuickFacts". United States Census Bureau. Archived from the original on July 11, 2011. Retrieved March 8, 2014.
- ↑ "Find a County". National Association of Counties. Archived from the original on 2011-05-31. Retrieved 2011-06-07.
- ↑ Rennick, Robert M. (1987). Kentucky Place Names. University Press of Kentucky. p. 138. Retrieved 2013-04-28.
- ↑ "Henry County". Kyenc.org. Retrieved April 23, 2013.
- ↑ Gannett, Henry (1905). The Origin of Certain Place Names in the United States. Govt. Print. Off. p. 155.
- ↑ "Henry County Voters Approve Full Sale Of Alcohol". WLKY News. December 16, 2015. Retrieved June 30, 2016.
- ↑ "2010 Census Gazetteer Files". United States Census Bureau. August 22, 2012. Archived from the original on August 12, 2014. Retrieved August 16, 2014.
- ↑ "Population and Housing Unit Estimates". Retrieved June 9, 2017.
- ↑ "U.S. Decennial Census". United States Census Bureau. Archived from the original on May 12, 2015. Retrieved August 16, 2014.
- ↑ "Historical Census Browser". University of Virginia Library. Retrieved August 16, 2014.
- ↑ "Population of Counties by Decennial Census: 1900 to 1990". United States Census Bureau. Retrieved August 16, 2014.
- ↑ "Census 2000 PHC-T-4. Ranking Tables for Counties: 1990 and 2000" (PDF). United States Census Bureau. Retrieved August 16, 2014.
- ↑ "American FactFinder". United States Census Bureau. Retrieved 2008-01-31.
- ↑ Leip, David. "Dave Leip's Atlas of U.S. Presidential Elections". uselectionatlas.org. Retrieved 2018-07-02.
External links
Municipalities and communities of Henry County, Kentucky, United States | ||
|---|---|---|
| Cities | | |
| Unincorporated communities | ||
| Footnotes | ‡This populated place also has portions in an adjacent county or counties | |