United States presidential election in Kentucky, 2012
|
| ||||||||||||||||||||||||||
| ||||||||||||||||||||||||||
| ||||||||||||||||||||||||||
 County Results
| ||||||||||||||||||||||||||
| ||||||||||||||||||||||||||
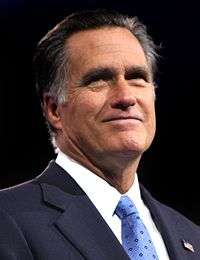
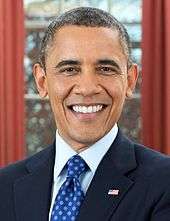
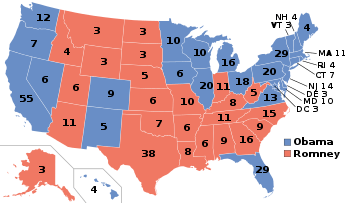
The 2012 United States presidential election in Kentucky took place on November 6, 2012, as part of the 2012 General Election in which all 50 states plus The District of Columbia participated. Kentucky voters chose eight electors to represent them in the Electoral College via a popular vote pitting incumbent Democratic President Barack Obama and his running mate, Vice President Joe Biden, against Republican challenger and former Massachusetts Governor Mitt Romney and his running mate, Congressman Paul Ryan.
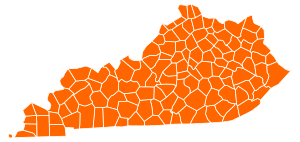
On election day Romney carried Kentucky by a landslide margin, winning 60.49% of the vote to Barack Obama's 37.80%, a margin of 22.69%.
Although Kentucky had been won by Southern Democrat Bill Clinton twice in the 1990s, Obama was seen as a poor cultural fit for the state, and he did not compete here either time he ran.
The Romney campaign also attacked Obama's administration as being hostile to the coal industry, historically an important part of the state's economy, because of its environmental harm. Consequently, Obama suffered a historically poor showing in the traditionally staunchly Democratic coalfields of Eastern Kentucky. Many counties which had voted even for landslide Democratic losers like George McGovern and Walter Mondale defected to the Republicans. Knott County, which had given Bill Clinton 73% of the vote in 1996, gave Mitt Romney 73% of the vote in 2012. Even Elliott County, the only county in the state in which Obama had broken 60% in 2008, barely held on in 2012, giving Obama a narrow 49-47 plurality win, his only victory in the region, and one of just four county wins in the entire state.
The only part of the state where Obama won convincingly was Jefferson County, the most urban and populous county in the state, where Louisville is located. He also eked out a close win in Fayette County, the second most populous county, home to Lexington. Obama's fourth county victory came from flipping Franklin County, home to the state capital of Frankfort, which he had narrowly lost in 2008.
General election
Results
On election night, Kentucky went as expected to the Republican candidate Massachusetts Governor Mitt Romney over Incumbent Democratic President Barack Obama of bordering Illinois. Obama was reelected but nonetheless, lost Kentucky. In most recent years Democrats have maintained their lead in registered voters compared to Republicans.[1] However, Kentucky is known as a highly conservative state with a populist streak. In most recent presidential elections in Kentucky, Democrats usually achieve lower 40 or upper 30 percent margins. Obama performed significantly worse in 2012 than he did in 2008. Appalachian Kentucky used to be a place were Democrats thrived because of working-class people, particularly unionized coal miners.[2] However this region has become more and more Republican in recent years. Romney performed, for the most part, very well statewide. Obama won four counties. Obama was however able to maintain a solid performance in perhaps the most Democratic place in the state, Jefferson County (Louisville Metro). The other counties Obama won were Franklin, Elliott and Fayette.
| United States presidential election in Kentucky, 2012[3] | ||||||
|---|---|---|---|---|---|---|
| Party | Candidate | Running mate | Votes | Percentage | Electoral votes | |
| Republican | Mitt Romney | Paul Ryan | 1,087,190 | 60.49% | 8 | |
| Democratic | Barack Obama | Joe Biden | 679,370 | 37.80% | 0 | |
| Libertarian | Gary Johnson | Jim Gray | 17,063 | 0.95% | 0 | |
| Independent | Randall Terry | Missy Smith | 6,872 | 0.38% | 0 | |
| Green | Jill Stein | Cheri Honkala | 6,337 | 0.35% | 0 | |
| Others | 380 | 0.02% | 0 | |||
| Totals | 1,797,212 | 100.00% | 8 | |||
| Voter turnout (registered voters) | 59.24% | |||||
By county
| County | Romney% | Romney# | Obama% | Obama# | Others% | Others# | Totals |
|---|---|---|---|---|---|---|---|
| Adair | 75.67% | 5,841 | 21.51% | 1,660 | 1.28% | 99 | 7,719 |
| Allen | 72.39% | 5,184 | 25.25% | 1,808 | 1.49% | 107 | 7,161 |
| Anderson | 65.38% | 6,822 | 31.77% | 3,315 | 1.73% | 181 | 10,435 |
| Ballard | 67.23% | 2,647 | 30.20% | 1,189 | 1.50% | 59 | 3,937 |
| Barren | 65.09% | 10,922 | 32.18% | 5,400 | 1.45% | 243 | 16,780 |
| Bath | 52.43% | 2,275 | 40.79% | 1,770 | 1.77% | 77 | 4,339 |
| Bell | 74.89% | 7,127 | 23.37% | 2,224 | 1.38% | 131 | 9,517 |
| Boone | 68.06% | 35,920 | 29.61% | 15,628 | 1.79% | 947 | 52,776 |
| Bourbon | 58.42% | 4,692 | 38.28% | 3,075 | 1.77% | 142 | 8,032 |
| Boyd | 56.10% | 10,883 | 40.08% | 7,776 | 1.96% | 381 | 19,399 |
| Boyle | 61.81% | 7,703 | 35.88% | 4,471 | 1.56% | 194 | 12,462 |
| Bracken | 60.53% | 2,029 | 34.22% | 1,147 | 1.61% | 54 | 3,352 |
| Breathitt | 63.62% | 3,318 | 29.95% | 1,562 | 2.45% | 128 | 5,215 |
| Breckinridge | 62.27% | 5,025 | 35.01% | 2,825 | 1.45% | 117 | 8,070 |
| Bullitt | 66.51% | 21,306 | 31.13% | 9,971 | 1.55% | 498 | 32,032 |
| Butler | 72.66% | 3,716 | 25.28% | 1,293 | 0.96% | 49 | 5,114 |
| Caldwell | 66.06% | 3,904 | 31.34% | 1,852 | 1.76% | 104 | 5,910 |
| Calloway | 62.15% | 9,438 | 34.99% | 5,314 | 2.05% | 312 | 15,186 |
| Campbell | 59.95% | 24,240 | 37.30% | 15,080 | 2.11% | 853 | 40,434 |
| Carlisle | 69.09% | 1,835 | 28.24% | 750 | 1.28% | 34 | 2,656 |
| Carroll | 53.54% | 1,999 | 43.63% | 1,629 | 1.39% | 52 | 3,734 |
| Carter | 59.27% | 5,279 | 37.99% | 3,383 | 2.74% | 244 | 8,906 |
| Casey | 80.51% | 4,904 | 17.83% | 1,086 | 1.66% | 101 | 6,091 |
| Christian | 61.38% | 13,475 | 37.59% | 8,252 | 1.03% | 226 | 21,953 |
| Clark | 64.45% | 9,931 | 33.93% | 5,228 | 1.63% | 251 | 15,410 |
| Clay | 83.65% | 6,176 | 15.05% | 1,111 | 1.30% | 96 | 7,383 |
| Clinton | 81.24% | 3,569 | 17.12% | 752 | 1.64% | 72 | 4,393 |
| Crittenden | 73.66% | 2,839 | 24.91% | 960 | 1.43% | 55 | 3,854 |
| Cumberland | 77.67% | 2,216 | 21.00% | 599 | 1.33% | 38 | 2,853 |
| Daviess | 59.63% | 25,092 | 38.52% | 16,208 | 1.85% | 779 | 42,079 |
| Edmonson | 69.30% | 3,232 | 29.46% | 1,374 | 1.24% | 58 | 4,664 |
| Elliott | 46.94% | 1,126 | 49.44% | 1,186 | 3.63% | 87 | 2,399 |
| Estill | 72.32% | 3,749 | 26.16% | 1,356 | 1.52% | 79 | 5,184 |
| Fayette | 48.32% | 60,793 | 49.34% | 62,078 | 2.34% | 2,950 | 125,821 |
| Fleming | 65.38% | 3,780 | 33.05% | 1,911 | 1.57% | 91 | 5,782 |
| Floyd | 65.71% | 9,784 | 31.79% | 4,733 | 2.51% | 373 | 14,890 |
| Franklin | 48.61% | 11,345 | 49.43% | 11,535 | 1.96% | 457 | 23,337 |
| Fulton | 57.44% | 1,425 | 41.19% | 1,022 | 1.37% | 34 | 2,481 |
| Gallatin | 57.45% | 1,758 | 40.46% | 1,238 | 2.09% | 64 | 3,060 |
| Garrard | 75.03% | 5,310 | 23.47% | 1,661 | 1.50% | 106 | 7,077 |
| Grant | 65.81% | 5,664 | 32.65% | 2,810 | 1.53% | 132 | 8,606 |
| Graves | 69.06% | 10,699 | 29.35% | 4,547 | 1.59% | 247 | 15,493 |
| Grayson | 69.09% | 6,404 | 29.60% | 2,744 | 1.31% | 121 | 9,269 |
| Green | 74.84% | 3,634 | 23.99% | 1,165 | 1.17% | 57 | 4,856 |
| Greenup | 58.41% | 8,855 | 39.76% | 6,027 | 1.83% | 277 | 15,159 |
| Hancock | 53.52% | 2,212 | 44.35% | 1,833 | 2.13% | 88 | 4,133 |
| Hardin | 59.57% | 23,357 | 38.80% | 15,214 | 1.63% | 641 | 39,212 |
| Harlan | 81.19% | 8,653 | 17.17% | 1,830 | 1.64% | 175 | 10,658 |
| Harrison | 63.60% | 4,556 | 34.50% | 2,471 | 1.90% | 136 | 7,163 |
| Hart | 64.28% | 4,256 | 34.48% | 2,283 | 1.24% | 82 | 6,621 |
| Henderson | 55.31% | 10,296 | 43.47% | 8,091 | 1.22% | 227 | 18,614 |
| Henry | 59.83% | 3,940 | 38.42% | 2,530 | 1.75% | 115 | 6,585 |
| Hickman | 66.90% | 1,431 | 32.07% | 686 | 1.03% | 22 | 2,139 |
| Hopkins | 69.22% | 13,681 | 29.29% | 5,789 | 1.49% | 295 | 19,765 |
| Jackson | 86.15% | 4,365 | 12.20% | 618 | 1.66% | 84 | 5,067 |
| Jefferson | 43.72% | 148,423 | 54.84% | 186,179 | 1.45% | 4,922 | 339,524 |
| Jessamine | 69.02% | 14,232 | 29.10% | 6,001 | 1.88% | 387 | 20,620 |
| Johnson | 78.53% | 7,095 | 19.07% | 1,723 | 2.40% | 217 | 9,035 |
| Kenton | 61.15% | 41,387 | 36.82% | 24,917 | 2.03% | 1,375 | 67,679 |
| Knott | 72.55% | 4,130 | 24.94% | 1,420 | 2.51% | 143 | 5,693 |
| Knox | 76.28% | 8,467 | 22.38% | 2,484 | 1.34% | 149 | 11,100 |
| LaRue | 67.85% | 3,911 | 30.07% | 1,733 | 2.08% | 120 | 5,764 |
| Laurel | 81.00% | 18,151 | 17.43% | 3,906 | 1.57% | 352 | 22,409 |
| Lawrence | 71.44% | 3,995 | 27.18% | 1,520 | 1.38% | 77 | 5,592 |
| Lee | 75.37% | 1,977 | 22.68% | 595 | 1.94% | 51 | 2,623 |
| Leslie | 89.68% | 4,439 | 8.75% | 433 | 1.58% | 78 | 4,950 |
| Letcher | 77.77% | 6,811 | 19.43% | 1,702 | 2.80% | 245 | 8,758 |
| Lewis | 69.74% | 3,326 | 28.14% | 1,342 | 2.12% | 101 | 4,769 |
| Lincoln | 70.10% | 6,416 | 28.21% | 2,582 | 1.68% | 154 | 9,152 |
| Livingston | 68.48% | 3,089 | 29.84% | 1,346 | 1.68% | 76 | 4,511 |
| Logan | 65.65% | 6,899 | 33.01% | 3,469 | 1.34% | 141 | 10,509 |
| Lyon | 62.85% | 2,412 | 35.77% | 1,373 | 1.38% | 53 | 3,838 |
| Madison | 63.42% | 21,128 | 34.55% | 11,512 | 2.03% | 677 | 33,317 |
| Magoffin | 69.12% | 3,391 | 29.21% | 1,433 | 1.67% | 82 | 4,906 |
| Marion | 51.94% | 3,800 | 46.72% | 3,418 | 1.34% | 98 | 7,316 |
| Marshall | 66.20% | 10,402 | 31.96% | 5,022 | 1.85% | 290 | 15,714 |
| Martin | 83.14% | 3,180 | 15.01% | 574 | 1.86% | 71 | 3,825 |
| Mason | 60.99% | 4,194 | 37.70% | 2,592 | 1.31% | 90 | 6,876 |
| McCracken | 65.42% | 19,979 | 32.95% | 10,062 | 1.63% | 499 | 30,540 |
| McCreary | 80.01% | 4,564 | 18.74% | 1,069 | 1.24% | 71 | 5,704 |
| McLean | 64.40% | 2,705 | 34.10% | 1,432 | 1.50% | 63 | 4,200 |
| Meade | 60.52% | 6,606 | 37.76% | 4,122 | 1.71% | 187 | 10,915 |
| Menifee | 57.12% | 1,484 | 40.34% | 1,048 | 2.54% | 66 | 2,598 |
| Mercer | 68.64% | 6,820 | 29.85% | 2,966 | 1.51% | 150 | 9,936 |
| Metcalfe | 63.96% | 2,676 | 34.06% | 1,425 | 1.98% | 83 | 4,184 |
| Monroe | 79.27% | 3,762 | 19.72% | 936 | 1.01% | 48 | 4,746 |
| Montgomery | 62.43% | 6,398 | 36.11% | 3,701 | 1.45% | 149 | 10,248 |
| Morgan | 67.55% | 3,021 | 30.61% | 1,369 | 1.83% | 82 | 4,472 |
| Muhlenberg | 60.94% | 7,762 | 37.46% | 4,771 | 1.60% | 204 | 12,737 |
| Nelson | 57.59% | 10,673 | 41.07% | 7,611 | 1.34% | 248 | 18,532 |
| Nicholas | 61.36% | 1,583 | 36.74% | 948 | 1.90% | 49 | 2,580 |
| Ohio | 67.07% | 6,470 | 30.97% | 2,987 | 1.96% | 189 | 9,646 |
| Oldham | 67.55% | 20,179 | 30.93% | 9,240 | 1.52% | 454 | 29,873 |
| Owen | 65.23% | 2,971 | 32.95% | 1,501 | 1.82% | 83 | 4,555 |
| Owsley | 80.95% | 1,279 | 17.91% | 283 | 1.14% | 18 | 1,580 |
| Pendleton | 64.26% | 3,556 | 33.59% | 1,859 | 2.15% | 119 | 5,534 |
| Perry | 78.52% | 8,040 | 19.99% | 2,047 | 1.49% | 153 | 10,240 |
| Pike | 74.43% | 17,589 | 23.89% | 5,645 | 1.68% | 398 | 23,632 |
| Powell | 61.38% | 2,726 | 36.48% | 1,620 | 2.14% | 95 | 4,441 |
| Pulaski | 79.66% | 20,714 | 19.14% | 4,976 | 1.20% | 313 | 26,003 |
| Robertson | 61.93% | 579 | 36.36% | 340 | 1.71% | 16 | 935 |
| Rockcastle | 80.89% | 5,028 | 17.65% | 1,097 | 1.46% | 91 | 6,216 |
| Rowan | 52.81% | 4,035 | 44.99% | 3,438 | 2.20% | 168 | 7,641 |
| Russell | 80.26% | 6,346 | 18.27% | 1,445 | 1.47% | 116 | 7,907 |
| Scott | 61.65% | 12,679 | 36.63% | 7,532 | 1.72% | 354 | 20,565 |
| Shelby | 63.19% | 11,790 | 35.55% | 6,634 | 1.26% | 235 | 18,659 |
| Simpson | 61.43% | 4,355 | 37.38% | 2,650 | 1.18% | 84 | 7,089 |
| Spencer | 67.92% | 5,726 | 30.23% | 2,549 | 1.85% | 156 | 8,431 |
| Taylor | 68.98% | 7,551 | 30.00% | 3,284 | 1.01% | 111 | 10,946 |
| Todd | 68.82% | 3,247 | 29.74% | 1,403 | 1.44% | 68 | 4,718 |
| Trigg | 67.06% | 4,520 | 31.38% | 2,115 | 1.56% | 105 | 6,740 |
| Trimble | 60.25% | 2,133 | 38.28% | 1,355 | 1.47% | 52 | 3,540 |
| Union | 66.14% | 3,952 | 32.49% | 1,941 | 1.37% | 82 | 5,975 |
| Warren | 60.12% | 26,384 | 38.29% | 16,805 | 1.59% | 700 | 43,889 |
| Washington | 66.98% | 3,495 | 31.99% | 1,669 | 1.03% | 54 | 5,218 |
| Wayne | 73.36% | 5,289 | 25.73% | 1,855 | 0.92% | 66 | 7,210 |
| Webster | 65.94% | 3,607 | 32.27% | 1,765 | 1.79% | 98 | 5,470 |
| Whitley | 78.30% | 10,232 | 20.53% | 2,683 | 1.17% | 153 | 13,068 |
| Wolfe | 60.26% | 1,542 | 38.14% | 976 | 1.60% | 41 | 2,559 |
| Woodford | 58.54% | 7,219 | 39.60% | 4,883 | 1.87% | 230 | 12,332 |
| Totals | 60.49% | 1,087,190 | 37.80% | 679,370 | 1.70% | 30,652 | 1,797,212 |
Democratic primary
Barack Obama's only "opponent" in the primary was the "Uncommited" ballot option, which garnered more than 42% of the primary vote, making Kentucky one of Obama's worst contested primary results.
| Kentucky Democratic primary, 2012[4] | |||
|---|---|---|---|
| Candidate | Votes | Percentage | Delegates |
| 119,293 | 57.85% | 39 | |
| Uncommited | 86,925 | 42.15% | 34 |
|
| |||||||||||||||||||
| |||||||||||||||||||
| |||||||||||||||||||
 Kentucky results by county
Barack Obama
Uncommited
Tie | |||||||||||||||||||
Republican primary
| Elections in Kentucky |
|---|
 |
|
|
Part of a series on the 2012 U.S. presidential election |
|---|
| Democratic Party |
| Republican Party |
| Related races |
The Republican primary occurred on May 22, 2012.[5][6] 42 delegates were chosen, all of which were allocated to and pledged to vote for Mitt Romney at the 2012 Republican National Convention. Three delegates remain unpledged to any candidate. All Republicans in Kentucky were allowed to participate in the primary. A Republican primary was also held in Arkansas on this day.
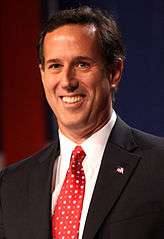
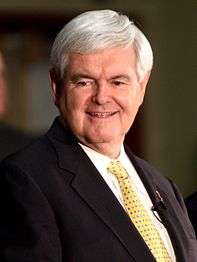
Rick Santorum and Newt Gingrich withdrew from the presidential race on April 10 and May 2, 2012, respectively. Both endorsed Mitt Romney as the Republican nominee.
|
| |||||||||||||||||||||||||||||||||||||||||||||||
| |||||||||||||||||||||||||||||||||||||||||||||||
| |||||||||||||||||||||||||||||||||||||||||||||||
 Kentucky results by county
Mitt Romney
(Note: Italicization indicates a withdrawn candidacy) | |||||||||||||||||||||||||||||||||||||||||||||||

| Kentucky Republican primary, 2012[7] | |||
|---|---|---|---|
| Candidate | Votes | Percentage | Delegates |
| 117,621 | 66.8% | 42 | |
| Ron Paul | 22,074 | 12.53% | 0 |
| Rick Santorum | 15,629 | 8.87% | 0 |
| Newt Gingrich | 10,479 | 5.95% | 0 |
| Uncommitted | 10,357 | 5.88% | 0 |
| Unpledged delegates: | 3 | ||
| Total: | 176,160 | 100.00% | 45 |
| Key: | Withdrew prior to contest |
See also
References
- ↑ "Registration Statistics - State Board of Elections". elect.ky.gov. Retrieved 2017-12-02.
- ↑ "Appalachia Used To Be A Democratic Stronghold. Here's How To Make It One Again". Retrieved 2017-12-02.
- ↑ "Kentucky State Board of Elections". Kentucky State Board of Elections.
- ↑ "Kentucky Secretary of State" (PDF). elect.ky.gov. May 22, 2012. Retrieved June 19, 2016.
- ↑ "Primary and Caucus Printable Calendar". CNN. Retrieved January 11, 2012.
- ↑ "Presidential Primary Dates" (PDF). Federal Election Commission. Retrieved January 23, 2012.
- ↑ Kentucky State Board of Elections
External links
- The Green Papers: for Kentucky
- The Green Papers: major state elections in chronological order
State results of the 2012 U.S. presidential election | ||
|---|---|---|
|  | |
| ||