Carter County, Kentucky
| Carter County, Kentucky | |
|---|---|
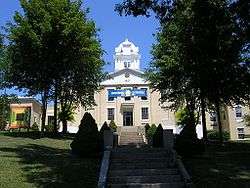 Carter County courthouse in Grayson | |
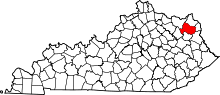 Location in the U.S. state of Kentucky | |
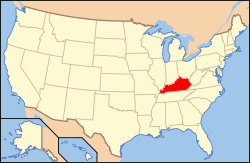 Kentucky's location in the U.S. | |
| Founded | 1838 |
| Named for | William Grayson Carter |
| Seat | Grayson |
| Largest city | Grayson |
| Area | |
| • Total | 412 sq mi (1,067 km2) |
| • Land | 409 sq mi (1,059 km2) |
| • Water | 2.6 sq mi (7 km2), 0.6% |
| Population | |
| • (2010) | 27,720 |
| • Density | 68/sq mi (26/km2) |
| Congressional district | 5th |
| Time zone | Eastern: UTC−5/−4 |
| Website |
cartercounty |
Carter County is a county located in the U.S. state of Kentucky. As of the 2010 census, the population was 27,720.[1] Its county seat is Grayson.[2]
Carter County is part of the Huntington-Ashland, WV-KY-OH Metropolitan Statistical Area.
History
Carter County was formed on February 9, 1838 from portions of Greenup County and Lawrence County.[3] It was named after Colonel William Grayson Carter, a Kentucky state Senator.[4] The county seat is named for his uncle, Robert Grayson. [5]
The original courthouse was rebuilt in 1907.[6]
Geography
According to the U.S. Census Bureau, the county has a total area of 412 square miles (1,070 km2), of which 409 square miles (1,060 km2) is land and 2.6 square miles (6.7 km2) (0.6%) is water.[7]
Adjacent counties
- Greenup County (northeast)
- Boyd County (east)
- Lawrence County (southeast)
- Elliott County (south)
- Rowan County (southwest)
- Lewis County (northwest)
Demographics
| Historical population | |||
|---|---|---|---|
| Census | Pop. | %± | |
| 1840 | 2,905 | — | |
| 1850 | 6,241 | 114.8% | |
| 1860 | 8,516 | 36.5% | |
| 1870 | 7,509 | −11.8% | |
| 1880 | 12,345 | 64.4% | |
| 1890 | 17,204 | 39.4% | |
| 1900 | 20,228 | 17.6% | |
| 1910 | 21,966 | 8.6% | |
| 1920 | 22,474 | 2.3% | |
| 1930 | 23,839 | 6.1% | |
| 1940 | 25,545 | 7.2% | |
| 1950 | 22,559 | −11.7% | |
| 1960 | 20,817 | −7.7% | |
| 1970 | 19,850 | −4.6% | |
| 1980 | 25,060 | 26.2% | |
| 1990 | 24,340 | −2.9% | |
| 2000 | 26,889 | 10.5% | |
| 2010 | 27,720 | 3.1% | |
| Est. 2016 | 27,046 | [8] | −2.4% |
| U.S. Decennial Census[9] 1790-1960[10] 1900-1990[11] 1990-2000[12] 2010-2013[1] | |||
As of the census[13] of 2000, there were 26,889 people, 10,342 households, and 7,746 families residing in the county. The population density was 66 per square mile (25/km2). There were 11,534 housing units at an average density of 28 per square mile (11/km2). The racial makeup of the county was 99.02% White, 0.13% Black or African American, 0.25% Native American, 0.11% Asian, 0.08% from other races, and 0.41% from two or more races. 0.59% of the population were Hispanic or Latino of any race.
There were 10,342 households out of which 33.50% had children under the age of 18 living with them, 60.50% were married couples living together, 10.70% had a female householder with no husband present, and 25.10% were non-families. 22.30% of all households were made up of individuals and 9.80% had someone living alone who was 65 years of age or older. The average household size was 2.54 and the average family size was 2.95.
In the county, the population was spread out with 24.50% under the age of 18, 10.80% from 18 to 24, 28.40% from 25 to 44, 23.80% from 45 to 64, and 12.50% who were 65 years of age or older. The median age was 36 years. For every 100 females there were 95.90 males. For every 100 females age 18 and over, there were 93.30 males.
The median income for a household in the county was $26,427, and the median income for a family was $31,278. Males had a median income of $28,690 versus $20,554 for females. The per capita income for the county was $13,442. About 19.20% of families and 22.30% of the population were below the poverty line, including 28.90% of those under age 18 and 21.30% of those age 65 or over.
Politics
| Year | Republican | Democratic | Third parties |
|---|---|---|---|
| 2016 | 73.8% 7,587 | 22.1% 2,276 | 4.0% 415 |
| 2012 | 59.3% 5,279 | 38.0% 3,383 | 2.8% 246 |
| 2008 | 53.5% 5,252 | 44.0% 4,316 | 2.5% 245 |
| 2004 | 48.8% 5,422 | 50.2% 5,577 | 1.1% 118 |
| 2000 | 51.5% 4,617 | 46.7% 4,182 | 1.8% 160 |
| 1996 | 41.7% 3,240 | 48.0% 3,728 | 10.3% 803 |
| 1992 | 38.6% 3,305 | 49.4% 4,224 | 12.0% 1,031 |
| 1988 | 48.4% 4,325 | 51.1% 4,570 | 0.6% 49 |
| 1984 | 53.7% 4,656 | 45.9% 3,985 | 0.4% 34 |
| 1980 | 50.2% 3,934 | 48.3% 3,782 | 1.6% 123 |
| 1976 | 44.7% 3,185 | 54.9% 3,915 | 0.5% 33 |
| 1972 | 60.7% 4,082 | 38.5% 2,591 | 0.8% 54 |
| 1968 | 49.7% 3,234 | 36.0% 2,344 | 14.3% 933 |
| 1964 | 40.4% 2,821 | 59.2% 4,136 | 0.4% 30 |
| 1960 | 58.8% 4,956 | 41.2% 3,479 | 0.0% 0 |
| 1956 | 62.1% 5,127 | 37.7% 3,112 | 0.2% 19 |
| 1952 | 58.1% 4,221 | 41.6% 3,019 | 0.3% 22 |
| 1948 | 52.6% 3,472 | 46.7% 3,082 | 0.7% 46 |
| 1944 | 60.0% 4,117 | 39.8% 2,733 | 0.2% 10 |
| 1940 | 56.9% 4,520 | 42.8% 3,403 | 0.3% 23 |
| 1936 | 56.0% 4,372 | 43.6% 3,403 | 0.5% 35 |
| 1932 | 48.5% 4,376 | 50.6% 4,565 | 0.9% 79 |
| 1928 | 68.7% 5,342 | 30.8% 2,392 | 0.5% 39 |
| 1924 | 61.5% 4,472 | 35.1% 2,552 | 3.4% 247 |
| 1920 | 62.0% 4,595 | 37.2% 2,757 | 0.8% 62 |
| 1916 | 58.5% 2,818 | 40.6% 1,954 | 1.0% 47 |
| 1912 | 28.6% 1,174 | 36.7% 1,506 | 34.6% 1,419 |
Education
- Carter County School District
- Kentucky Christian University, located in Grayson
Alcohol sales
Carter County is a moist county, meaning that sale of alcohol in the county is prohibited except in certain areas as voted on by the residents of the area, with at least one area approving full retail alcohol sales. In the case of Carter County, alcohol sales are only permitted as follows:
- At a single approved winery in the Iron Hill precinct, near the unincorporated community of Carter City.
- Within the city of Grayson after a vote on June 11, 2013 approved full retail alcohol sales within the city limits by a vote of 511 in favor of alcohol sales to 393 against.[15][16][17]
- Within the city of Olive Hill after a vote on March 10, 2014 approved full retail alcohol sales within the city limits by a vote of 257 in favor of alcohol sales to 206 against.[18]
Communities
Cities
- Grayson (county seat)
- Olive Hill
Unincorporated Communities
See also
References
- 1 2 "State & County QuickFacts". United States Census Bureau. Retrieved March 6, 2014.
- ↑ "Find a County". National Association of Counties. Archived from the original on 2011-05-31. Retrieved 2011-06-07.
- ↑ Rennick, Robert M. (1987). Kentucky Place Names. University Press of Kentucky. p. 52. Retrieved 2013-04-28.
- ↑ The Register of the Kentucky State Historical Society, Volume 1. Kentucky State Historical Society. 1903. p. 34.
- ↑ "Historical Views Of Carter County" (PDF). Printworks Unlimited, Grayson, KY. 2007. p. 1.
- ↑ Hogan, Roseann Reinemuth (1992). Kentucky Ancestry: A Guide to Genealogical and Historical Research. Ancestry Publishing. p. 212. Retrieved 26 July 2013.
- ↑ "2010 Census Gazetteer Files". United States Census Bureau. August 22, 2012. Archived from the original on August 12, 2014. Retrieved August 13, 2014.
- ↑ "Population and Housing Unit Estimates". Retrieved June 9, 2017.
- ↑ "U.S. Decennial Census". United States Census Bureau. Archived from the original on April 22, 2013. Retrieved August 13, 2014.
- ↑ "Historical Census Browser". University of Virginia Library. Retrieved August 13, 2014.
- ↑ "Population of Counties by Decennial Census: 1900 to 1990". United States Census Bureau. Retrieved August 13, 2014.
- ↑ "Census 2000 PHC-T-4. Ranking Tables for Counties: 1990 and 2000" (PDF). United States Census Bureau. Retrieved August 13, 2014.
- ↑ "American FactFinder". United States Census Bureau. Archived from the original on 2013-09-11. Retrieved 2008-01-31.
- ↑ Leip, David. "Dave Leip's Atlas of U.S. Presidential Elections". uselectionatlas.org. Retrieved 2018-06-30.
- ↑ The Next Step: Grayson council has the task of controlling alcohol sales.
- ↑ Grayson takes the first step toward alcohol sales.
- ↑ Council approves equipment purchases.
- ↑ Olive Hill Votes Wet
External links
![]()
Municipalities and communities of Carter County, Kentucky, United States | ||
|---|---|---|
| Cities | | |
| Unincorporated communities | ||
| Footnotes | ‡This populated place also has portions in an adjacent county or counties | |
| Principal cities | 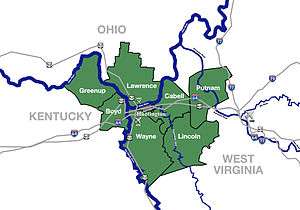 | |
|---|---|---|
| Municipalities with population over 5,000 | ||
| Municipalities with population 1,000–5,000 | ||
| Municipalities with population under 1,000 | ||
| West Virginia counties | ||
| Kentucky counties | ||
| Ohio counties | ||