Opinion polling
| List of polls |
|
Delegate count: 55 Pledged, 5 Unpledged
- Winner
 Hillary Clinton Hillary Clinton- Primary date
- May 17, 2016
| Poll source |
Date |
1st |
2nd |
3rd |
Other |
| Official Primary results |
May 17, 2016 |
Hillary Clinton
46.8% |
Bernie Sanders
46.3% |
|
Others / Uncommitted
6.9% |
| Public Policy Polling[2]
Margin of error: ± 4.4%
Sample size: 501 |
March 1-2, 2016 |
Hillary Clinton
43% |
Bernie Sanders
38% |
|
Others / Undecided
19% |
| Public Policy Polling[3]
Margin of error: ± 4%
Sample size: 610 |
June 18–21, 2015 |
Hillary Clinton
56% |
Bernie Sanders
12% |
Jim Webb
7% |
Lincoln Chafee 5%, Martin O'Malley 3%, Not sure 18% |
|
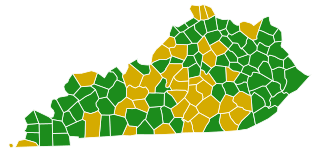
Results
Results by county
| County[4] |
Clinton |
Votes |
Sanders |
Votes |
| Adair | 49.6% | 466 | 43.7% | 410 |
| Allen | 46.0% | 427 | 47.4% | 440 |
| Anderson | 36.0% | 1,132 | 52.4% | 1,649 |
| Ballard | 32.0% | 405 | 52.0% | 659 |
| Barren | 37.2% | 1,979 | 49.9% | 2,653 |
| Bath | 45.6% | 628 | 46.6% | 641 |
| Bell | 44.7% | 567 | 45.6% | 578 |
| Boone | 51.8% | 2,932 | 44.1% | 2,496 |
| Bourbon | 46.5% | 1,109 | 45.6% | 1,087 |
| Boyd | 44.7% | 2,193 | 46.1% | 2,262 |
| Boyle | 49.9% | 1,648 | 43.9% | 1,451 |
| Bracken | 32.5% | 251 | 54.9% | 424 |
| Breathitt | 33.9% | 1,123 | 51.8% | 1,716 |
| Breckinridge | 45.9% | 877 | 45.8% | 875 |
| Bullitt | 44.4% | 2,907 | 49.1% | 3,210 |
| Butler | 51.1% | 238 | 42.1% | 196 |
| Caldwell | 34.3% | 570 | 52.1% | 866 |
| Calloway | 35.8% | 1,460 | 55.0% | 2,239 |
| Campbell | 48.1% | 3,169 | 47.5% | 3,133 |
| Carlisle | 25.6% | 206 | 57.5% | 462 |
| Carroll | 41.5% | 481 | 49.4% | 573 |
| Carter | 39.1% | 800 | 51.4% | 1,051 |
| Casey | 50.7% | 210 | 44.0% | 182 |
| Christian | 50.2% | 2,437 | 39.9% | 1,936 |
| Clark | 45.5% | 1,810 | 47.5% | 1,888 |
| Clay | 48.4% | 184 | 41.6% | 158 |
| Clinton | 57.9% | 151 | 35.6% | 93 |
| Crittenden | 35.6% | 240 | 51.0% | 344 |
| Cumberland | 44.8% | 78 | 50.0% | 87 |
| Daviess | 45.5% | 5,066 | 46.6% | 5,188 |
| Edmonson | 49.5% | 275 | 47.1% | 262 |
| Elliott | 35.7% | 301 | 52.6% | 443 |
| Estill | 47.6% | 446 | 47.0% | 440 |
| Fayette | 52.8% | 20,014 | 45.0% | 17,048 |
| Fleming | 40.7% | 627 | 52.3% | 806 |
| Floyd | 31.4% | 2,327 | 54.1% | 4,010 |
| Franklin | 45.1% | 5,218 | 46.6% | 5,398 |
| Fulton | 46.6% | 315 | 36.2% | 245 |
| Gallatin | 39.5% | 260 | 51.6% | 340 |
| Garrard | 50.5% | 434 | 45.0% | 387 |
| Grant | 40.9% | 594 | 49.2% | 715 |
| Graves | 31.8% | 1,631 | 51.3% | 2,631 |
| Grayson | 49.9% | 705 | 44.6% | 630 |
| Green | 40.4% | 284 | 51.2% | 360 |
| Greenup | 43.8% | 1,517 | 47.7% | 1,655 |
| Hancock | 42.5% | 491 | 49.7% | 573 |
| Hardin | 47.8% | 4,359 | 46.2% | 4,208 |
| Harlan | 25.9% | 451 | 62.8% | 1,092 |
| Harrison | 41.4% | 886 | 49.5% | 1,059 |
| Hart | 39.7% | 817 | 51.6% | 1,062 |
| Henderson | 43.4% | 2,887 | 42.9% | 2,850 |
| Henry | 40.6% | 781 | 49.8% | 958 |
| Hickman | 32.5% | 209 | 46.6% | 300 |
| Hopkins | 32.7% | 1,690 | 52.2% | 2,696 |
| Jackson | 35.9% | 78 | 59.0% | 128 |
| Jefferson | 57.3% | 64,090 | 40.3% | 45,048 |
| Jessamine | 44.2% | 1,875 | 49.8% | 2,113 |
| Johnson | 32.9% | 444 | 55.5% | 749 |
| Kenton | 49.0% | 5,146 | 46.5% | 4,880 |
| Knott | 30.8% | 583 | 58.8% | 1,114 |
| Knox | 47.9% | 520 | 46.4% | 504 |
| LaRue | 34.7% | 612 | 51.6% | 910 |
| Laurel | 49.1% | 845 | 45.9% | 791 |
| Lawrence | 35.3% | 444 | 52.4% | 659 |
| Lee | 42.9% | 199 | 48.3% | 224 |
| Leslie | 43.8% | 64 | 52.7% | 77 |
| Letcher | 26.7% | 838 | 56.9% | 1,788 |
| Lewis | 51.7% | 211 | 37.0% | 151 |
| Lincoln | 47.7% | 779 | 45.5% | 742 |
| Livingston | 34.4% | 400 | 52.4% | 610 |
| Logan | 43.8% | 1,077 | 46.0% | 1,131 |
| Lyon | 40.5% | 497 | 45.7% | 561 |
| Madison | 41.6% | 3,441 | 53.0% | 4,385 |
| Magoffin | 42.7% | 511 | 52.3% | 626 |
| Marion | 50.3% | 1,162 | 42.6% | 983 |
| Marshall | 34.7% | 1,577 | 50.8% | 2,308 |
| Martin | 31.2% | 104 | 57.4% | 191 |
| Mason | 44.1% | 727 | 47.0% | 775 |
| McCracken | 43.8% | 3,334 | 46.5% | 3,541 |
| McCreary | 41.9% | 169 | 50.4% | 203 |
| McLean | 38.1% | 477 | 50.1% | 628 |
| Meade | 41.9% | 1,312 | 49.2% | 1,541 |
| Menifee | 44.8% | 311 | 46.5% | 323 |
| Mercer | 39.1% | 988 | 52.6% | 1,331 |
| Metcalfe | 41.7% | 506 | 47.9% | 582 |
| Monroe | 50.8% | 126 | 44.0% | 109 |
| Montgomery | 45.8% | 1,289 | 47.0% | 1,322 |
| Morgan | 31.6% | 544 | 57.3% | 988 |
| Muhlenberg | 43.3% | 1,544 | 45.7% | 1,632 |
| Nelson | 47.6% | 2,395 | 46.6% | 2,345 |
| Nicholas | 42.2% | 353 | 50.2% | 420 |
| Ohio | 41.3% | 778 | 50.0% | 943 |
| Oldham | 52.4% | 2,730 | 44.4% | 2,315 |
| Owen | 34.6% | 453 | 55.0% | 720 |
| Owsley | 43.3% | 77 | 51.1% | 91 |
| Pendleton | 36.6% | 388 | 51.5% | 546 |
| Perry | 30.0% | 839 | 59.6% | 1,666 |
| Pike | 26.1% | 2,335 | 54.3% | 4,848 |
| Powell | 42.4% | 623 | 50.7% | 744 |
| Pulaski | 47.4% | 1,169 | 46.6% | 1,148 |
| Robertson | 32.0% | 95 | 59.6% | 177 |
| Rockcastle | 45.7% | 238 | 48.8% | 254 |
| Rowan | 44.0% | 1,170 | 51.2% | 1,363 |
| Russell | 48.2% | 343 | 46.7% | 332 |
| Scott | 48.6% | 2,505 | 46.4% | 2,394 |
| Shelby | 47.8% | 2,195 | 44.5% | 2,044 |
| Simpson | 45.9% | 708 | 45.1% | 695 |
| Spencer | 42.7% | 673 | 51.2% | 806 |
| Taylor | 50.3% | 949 | 44.8% | 844 |
| Todd | 35.1% | 333 | 53.5% | 507 |
| Trigg | 40.8% | 604 | 48.3% | 715 |
| Trimble | 38.3% | 415 | 50.0% | 542 |
| Union | 29.9% | 672 | 49.3% | 1,106 |
| Warren | 44.9% | 4,829 | 49.9% | 5,365 |
| Washington | 47.0% | 601 | 45.5% | 582 |
| Wayne | 55.6% | 502 | 39.4% | 356 |
| Webster | 28.7% | 693 | 48.5% | 1,169 |
| Whitley | 52.5% | 522 | 41.1% | 409 |
| Wolfe | 42.1% | 414 | 50.7% | 499 |
| Woodford | 46.3% | 1,862 | 47.7% | 1,918 |
| Total | 46.8% | 212,550 | 46.3% | 210,626 |
Analysis
Clinton's strength with conservative white voters in the Appalachia region, including Coal Country, had clearly regressed since 2008; she had beaten Barack Obama 65-29 in Kentucky eight years earlier, and only beat rival Bernie Sanders 47-46 in 2016. She ran strongly in Louisville, where the African American population is highest, but lost many of the eastern counties in the state to Bernie Sanders, who had won a large victory in neighboring West Virginia the week prior.