| Elections in Kentucky |
|---|
 |
|
|
|
|
|
|
|
|
 Government Government |
|
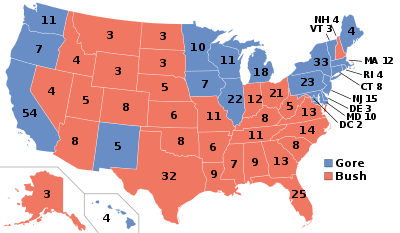
The 2000 United States presidential election in Kentucky took place on November 7, 2000, as part of the 2000 United States presidential election, which included elections in all 50 states and D.C.. Voters chose 8 representatives, or electors to the Electoral College, who voted for president and vice president.
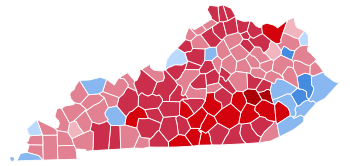
Kentucky was won by Governor George W. Bush. He won most of the counties and congressional districts in the state. Bush dominated among the rural areas of the state. The only congressional district Gore won was the third district, which is a part of Jefferson County, Kentucky, the highest populated county in the state. The only other region where Gore performed strongly was in the coal dependent counties in the southeastern part of the state. As of the 2016 presidential election, this is the last election in which Boyd County, Muhlenberg County, Harlan County, Perry County, Letcher County, Ballard County, and Fulton County voted for the Democratic candidate.
Results
By county
| County |
Gore% |
Gore# |
Bush% |
Bush# |
Others% |
Others# |
Total |
| Adair County | 24.28% | 1,779 | 74.51% | 5,460 | 1.21% | 89 | 7,328 |
| Allen County | 30.33% | 1,950 | 68.67% | 4,415 | 1.00% | 64 | 6,429 |
| Anderson County | 36.43% | 2,902 | 61.62% | 4,909 | 1.96% | 156 | 7,967 |
| Ballard County | 49.88% | 1,880 | 48.39% | 1,824 | 1.72% | 65 | 3,769 |
| Barren County | 35.61% | 4,930 | 63.14% | 8,741 | 1.25% | 173 | 13,844 |
| Bath County | 46.66% | 2,087 | 51.49% | 2,303 | 1.86% | 83 | 4,473 |
| Bell County | 45.11% | 4,787 | 52.63% | 5,585 | 2.25% | 239 | 10,611 |
| Boone County | 28.91% | 9,248 | 68.83% | 22,016 | 2.25% | 720 | 31,984 |
| Bourbon County | 42.92% | 3,048 | 54.65% | 3,881 | 2.44% | 173 | 7,102 |
| Boyd County | 49.74% | 9,541 | 48.21% | 9,247 | 2.05% | 394 | 19,182 |
| Boyle County | 38.38% | 3,963 | 59.33% | 6,126 | 2.30% | 237 | 10,326 |
| Bracken County | 29.41% | 888 | 68.40% | 2,065 | 2.19% | 66 | 3,019 |
| Breathitt County | 57.20% | 2,902 | 41.08% | 2,084 | 1.71% | 87 | 5,073 |
| Breckinridge County | 34.82% | 2,595 | 63.91% | 4,763 | 1.27% | 95 | 7,453 |
| Bullitt County | 36.13% | 8,195 | 61.97% | 14,054 | 1.90% | 430 | 22,679 |
| Butler County | 25.93% | 1,299 | 72.93% | 3,654 | 1.14% | 57 | 5,010 |
| Caldwell County | 40.55% | 2,223 | 57.66% | 3,161 | 1.79% | 98 | 5,482 |
| Calloway County | 41.21% | 5,635 | 56.35% | 7,705 | 2.44% | 333 | 13,673 |
| Campbell County | 35.61% | 12,040 | 61.49% | 20,789 | 2.90% | 980 | 33,809 |
| Carlisle County | 44.31% | 1,149 | 54.18% | 1,405 | 1.50% | 39 | 2,593 |
| Carroll County | 45.76% | 1,601 | 51.96% | 1,818 | 2.29% | 80 | 3,499 |
| Carter County | 46.68% | 4,182 | 51.53% | 4,617 | 1.79% | 160 | 8,959 |
| Casey County | 20.52% | 1,122 | 78.33% | 4,284 | 1.15% | 63 | 5,469 |
| Christian County | 38.14% | 6,778 | 60.69% | 10,787 | 1.17% | 208 | 17,773 |
| Clark County | 39.52% | 4,918 | 58.64% | 7,297 | 1.83% | 228 | 12,443 |
| Clay County | 25.64% | 1,723 | 73.31% | 4,926 | 1.04% | 70 | 6,719 |
| Clinton County | 23.97% | 1,032 | 74.89% | 3,224 | 1.14% | 49 | 4,305 |
| Crittenden County | 38.76% | 1,610 | 59.44% | 2,469 | 1.81% | 75 | 4,154 |
| Cumberland County | 24.48% | 736 | 73.85% | 2,220 | 1.66% | 50 | 3,006 |
| Daviess County | 38.98% | 14,126 | 58.94% | 21,361 | 2.08% | 753 | 36,240 |
| Edmonson County | 34.23% | 1,710 | 65.07% | 3,250 | 0.70% | 35 | 4,995 |
| Elliott County | 64.05% | 1,525 | 34.73% | 827 | 1.22% | 29 | 2,381 |
| Estill County | 33.78% | 1,591 | 64.39% | 3,033 | 1.83% | 86 | 4,710 |
| Fayette County | 44.82% | 47,277 | 51.67% | 54,495 | 3.51% | 3,703 | 105,475 |
| Fleming County | 35.01% | 1,813 | 63.37% | 3,282 | 1.62% | 84 | 5,179 |
| Floyd County | 65.53% | 10,088 | 32.92% | 5,068 | 1.55% | 238 | 15,394 |
| Franklin County | 50.12% | 10,853 | 47.15% | 10,209 | 2.73% | 592 | 21,654 |
| Fulton County | 52.08% | 1,452 | 46.38% | 1,293 | 1.54% | 43 | 2,788 |
| Gallatin County | 42.66% | 1,049 | 54.70% | 1,345 | 2.64% | 65 | 2,459 |
| Garrard County | 29.42% | 1,713 | 69.43% | 4,043 | 1.15% | 67 | 5,823 |
| Grant County | 36.15% | 2,568 | 62.02% | 4,405 | 1.83% | 130 | 7,103 |
| Graves County | 42.84% | 6,097 | 55.15% | 7,849 | 2.00% | 285 | 14,231 |
| Grayson County | 30.45% | 2,604 | 68.33% | 5,843 | 1.22% | 104 | 8,551 |
| Green County | 22.81% | 1,085 | 76.01% | 3,615 | 1.18% | 56 | 4,756 |
| Greenup County | 48.86% | 7,164 | 49.33% | 7,233 | 1.81% | 266 | 14,663 |
| Hancock County | 41.77% | 1,508 | 56.29% | 2,032 | 1.94% | 70 | 3,610 |
| Hardin County | 36.15% | 11,095 | 61.79% | 18,964 | 2.06% | 631 | 30,690 |
| Harlan County | 50.93% | 5,365 | 47.27% | 4,980 | 1.80% | 190 | 10,535 |
| Harrison County | 40.21% | 2,658 | 57.37% | 3,793 | 2.42% | 160 | 6,611 |
| Hart County | 36.57% | 2,201 | 61.89% | 3,725 | 1.55% | 93 | 6,019 |
| Henderson County | 50.22% | 8,054 | 48.00% | 7,698 | 1.79% | 287 | 16,039 |
| Henry County | 38.68% | 2,117 | 59.27% | 3,244 | 2.05% | 112 | 5,473 |
| Hickman County | 44.26% | 940 | 54.19% | 1,151 | 1.55% | 33 | 2,124 |
| Hopkins County | 40.84% | 6,734 | 57.55% | 9,490 | 1.61% | 265 | 16,489 |
| Jackson County | 14.44% | 701 | 84.02% | 4,079 | 1.54% | 75 | 4,855 |
| Jefferson County | 49.58% | 149,901 | 47.97% | 145,052 | 2.45% | 7,408 | 302,361 |
| Jessamine County | 30.76% | 4,633 | 66.89% | 10,074 | 2.35% | 354 | 15,061 |
| Johnson County | 39.74% | 3,251 | 58.47% | 4,783 | 1.78% | 146 | 8,180 |
| Kenton County | 33.97% | 19,100 | 62.90% | 35,363 | 3.13% | 1,760 | 56,223 |
| Knott County | 67.34% | 4,349 | 31.42% | 2,029 | 1.24% | 80 | 6,458 |
| Knox County | 37.24% | 3,690 | 61.13% | 6,058 | 1.63% | 162 | 9,910 |
| LaRue County | 33.35% | 1,727 | 65.34% | 3,384 | 1.31% | 68 | 5,179 |
| Laurel County | 26.80% | 4,856 | 71.90% | 13,029 | 1.30% | 235 | 18,120 |
| Lawrence County | 42.55% | 2,258 | 55.94% | 2,969 | 1.51% | 80 | 5,307 |
| Lee County | 30.25% | 836 | 68.49% | 1,893 | 1.27% | 35 | 2,764 |
| Leslie County | 27.29% | 1,210 | 71.24% | 3,159 | 1.47% | 65 | 4,434 |
| Letcher County | 52.29% | 4,698 | 45.54% | 4,092 | 2.17% | 195 | 8,985 |
| Lewis County | 28.31% | 1,293 | 70.42% | 3,217 | 1.27% | 58 | 4,568 |
| Lincoln County | 35.25% | 2,678 | 63.12% | 4,795 | 1.63% | 124 | 7,597 |
| Livingston County | 47.80% | 2,022 | 50.07% | 2,118 | 2.13% | 90 | 4,230 |
| Logan County | 41.63% | 3,885 | 57.27% | 5,344 | 1.10% | 103 | 9,332 |
| Lyon County | 49.12% | 1,680 | 49.36% | 1,688 | 1.52% | 52 | 3,420 |
| McCracken County | 42.76% | 11,412 | 55.25% | 14,745 | 1.99% | 532 | 26,689 |
| McCreary County | 29.55% | 1,418 | 69.20% | 3,321 | 1.25% | 60 | 4,799 |
| McLean County | 43.44% | 1,747 | 55.17% | 2,219 | 1.39% | 56 | 4,022 |
| Madison County | 39.33% | 9,309 | 57.81% | 13,682 | 2.85% | 675 | 23,666 |
| Magoffin County | 47.74% | 2,603 | 51.07% | 2,785 | 1.19% | 65 | 5,453 |
| Marion County | 44.98% | 2,778 | 52.77% | 3,259 | 2.25% | 139 | 6,176 |
| Marshall County | 45.08% | 6,203 | 53.00% | 7,294 | 1.92% | 264 | 13,761 |
| Martin County | 38.46% | 1,714 | 59.85% | 2,667 | 1.68% | 75 | 4,456 |
| Mason County | 37.08% | 2,178 | 60.82% | 3,572 | 2.09% | 123 | 5,873 |
| Meade County | 39.64% | 3,596 | 58.64% | 5,319 | 1.72% | 156 | 9,071 |
| Menifee County | 46.15% | 1,038 | 52.02% | 1,170 | 1.82% | 41 | 2,249 |
| Mercer County | 35.82% | 3,092 | 62.12% | 5,362 | 2.06% | 178 | 8,632 |
| Metcalfe County | 34.24% | 1,318 | 64.33% | 2,476 | 1.43% | 55 | 3,849 |
| Monroe County | 20.79% | 1,158 | 78.60% | 4,377 | 0.61% | 34 | 5,569 |
| Montgomery County | 44.99% | 3,833 | 53.22% | 4,534 | 1.78% | 152 | 8,519 |
| Morgan County | 44.22% | 1,875 | 54.13% | 2,295 | 1.65% | 70 | 4,240 |
| Muhlenberg County | 52.65% | 6,295 | 46.15% | 5,518 | 1.20% | 143 | 11,956 |
| Nelson County | 40.64% | 5,481 | 57.19% | 7,714 | 2.17% | 293 | 13,488 |
| Nicholas County | 37.19% | 994 | 60.34% | 1,613 | 2.47% | 66 | 2,673 |
| Ohio County | 37.19% | 3,303 | 60.94% | 5,413 | 1.87% | 166 | 8,882 |
| Oldham County | 30.77% | 6,236 | 67.00% | 13,580 | 2.23% | 452 | 20,268 |
| Owen County | 34.25% | 1,394 | 63.44% | 2,582 | 2.31% | 94 | 4,070 |
| Owsley County | 18.57% | 339 | 80.28% | 1,466 | 1.15% | 21 | 1,826 |
| Pendleton County | 34.77% | 1,670 | 63.38% | 3,044 | 1.85% | 89 | 4,803 |
| Perry County | 50.15% | 5,514 | 48.20% | 5,300 | 1.66% | 182 | 10,996 |
| Pike County | 54.59% | 13,611 | 44.13% | 11,005 | 1.28% | 319 | 24,935 |
| Powell County | 46.17% | 2,008 | 51.92% | 2,258 | 1.91% | 83 | 4,349 |
| Pulaski County | 25.14% | 5,415 | 73.56% | 15,845 | 1.30% | 281 | 21,541 |
| Robertson County | 34.17% | 341 | 63.13% | 630 | 2.71% | 27 | 998 |
| Rockcastle County | 22.37% | 1,174 | 76.08% | 3,992 | 1.54% | 81 | 5,247 |
| Rowan County | 48.51% | 3,505 | 49.07% | 3,546 | 2.42% | 175 | 7,226 |
| Russell County | 24.17% | 1,710 | 74.47% | 5,268 | 1.36% | 96 | 7,074 |
| Scott County | 39.69% | 5,472 | 57.68% | 7,952 | 2.63% | 362 | 13,786 |
| Shelby County | 34.82% | 4,435 | 63.34% | 8,068 | 1.84% | 235 | 12,738 |
| Simpson County | 44.35% | 2,583 | 54.41% | 3,169 | 1.24% | 72 | 5,824 |
| Spencer County | 32.56% | 1,554 | 66.01% | 3,150 | 1.42% | 68 | 4,772 |
| Taylor County | 30.83% | 2,790 | 67.96% | 6,151 | 1.22% | 110 | 9,051 |
| Todd County | 35.73% | 1,496 | 63.20% | 2,646 | 1.07% | 45 | 4,187 |
| Trigg County | 39.48% | 2,110 | 58.57% | 3,130 | 1.95% | 104 | 5,344 |
| Trimble County | 38.33% | 1,181 | 59.62% | 1,837 | 2.04% | 63 | 3,081 |
| Union County | 47.45% | 2,547 | 51.21% | 2,749 | 1.34% | 72 | 5,368 |
| Warren County | 36.94% | 12,180 | 61.36% | 20,235 | 1.70% | 560 | 32,975 |
| Washington County | 31.78% | 1,458 | 66.35% | 3,044 | 1.87% | 86 | 4,588 |
| Wayne County | 35.71% | 2,312 | 62.85% | 4,069 | 1.44% | 93 | 6,474 |
| Webster County | 47.08% | 2,388 | 51.24% | 2,599 | 1.68% | 85 | 5,072 |
| Whitley County | 34.83% | 4,101 | 63.72% | 7,502 | 1.45% | 171 | 11,774 |
| Wolfe County | 46.85% | 1,136 | 52.25% | 1,267 | 0.91% | 22 | 2,425 |
| Woodford County | 39.41% | 3,995 | 58.10% | 5,890 | 2.49% | 252 | 10,137 |
Electors
Technically the voters of Kentucky cast their ballots for electors: representatives to the Electoral College. Kentucky is allocated 8 electors because it has 6 congressional districts and 2 senators. All candidates who appear on the ballot or qualify to receive write-in votes must submit a list of 8 electors, who pledge to vote for their candidate and his or her running mate. Whoever wins the majority of votes in the state is awarded all 8 electoral votes. Their chosen electors then vote for president and vice president. Although electors are pledged to their candidate and running mate, they are not obligated to vote for them. An elector who votes for someone other than his or her candidate is known as a faithless elector.
The electors of each state and the District of Columbia met on December 18, 2000[1] to cast their votes for president and vice president. The Electoral College itself never meets as one body. Instead the electors from each state and the District of Columbia met in their respective capitols.
The following were the members of the Electoral College from the state. All were pledged to and voted for George W. Bush and Dick Cheney:[2]
- George S. Beard
- William S. Farish Jr
- Robert B. Fearing
- Connie S. Hayes
- G. Richard Noss Jr.
- A. Douglas Reece
- Michael A. Shea
- Larry Joe Walden
References
|
|---|
| Candidates | | |
|---|
General
articles | |
|---|
Local
results | |
|---|
Other 2000
elections | |
|---|